Elettra
Elettra is a project that rethinks the in-car experience for people who aren’t used to driving electric, and teaches them to brake correctly.
- Role
- UX/UI Designer
- My part
- User research and experience design
- With
- Alessandro Cesa, Clara Di Bella, Margherita Nisco, Nicola Pizzato
- Timeline
- Sep 2024 – Feb 2025
- Tools
- Figma, ProtoPie, Adobe Creative Cloud
Problem
EV drivers keep braking the way they did in petrol cars. They don’t realise they are wasting energy, or how much they could recover by braking correctly. Within 3–6 months they stop trusting the car’s consumption data.
Solution
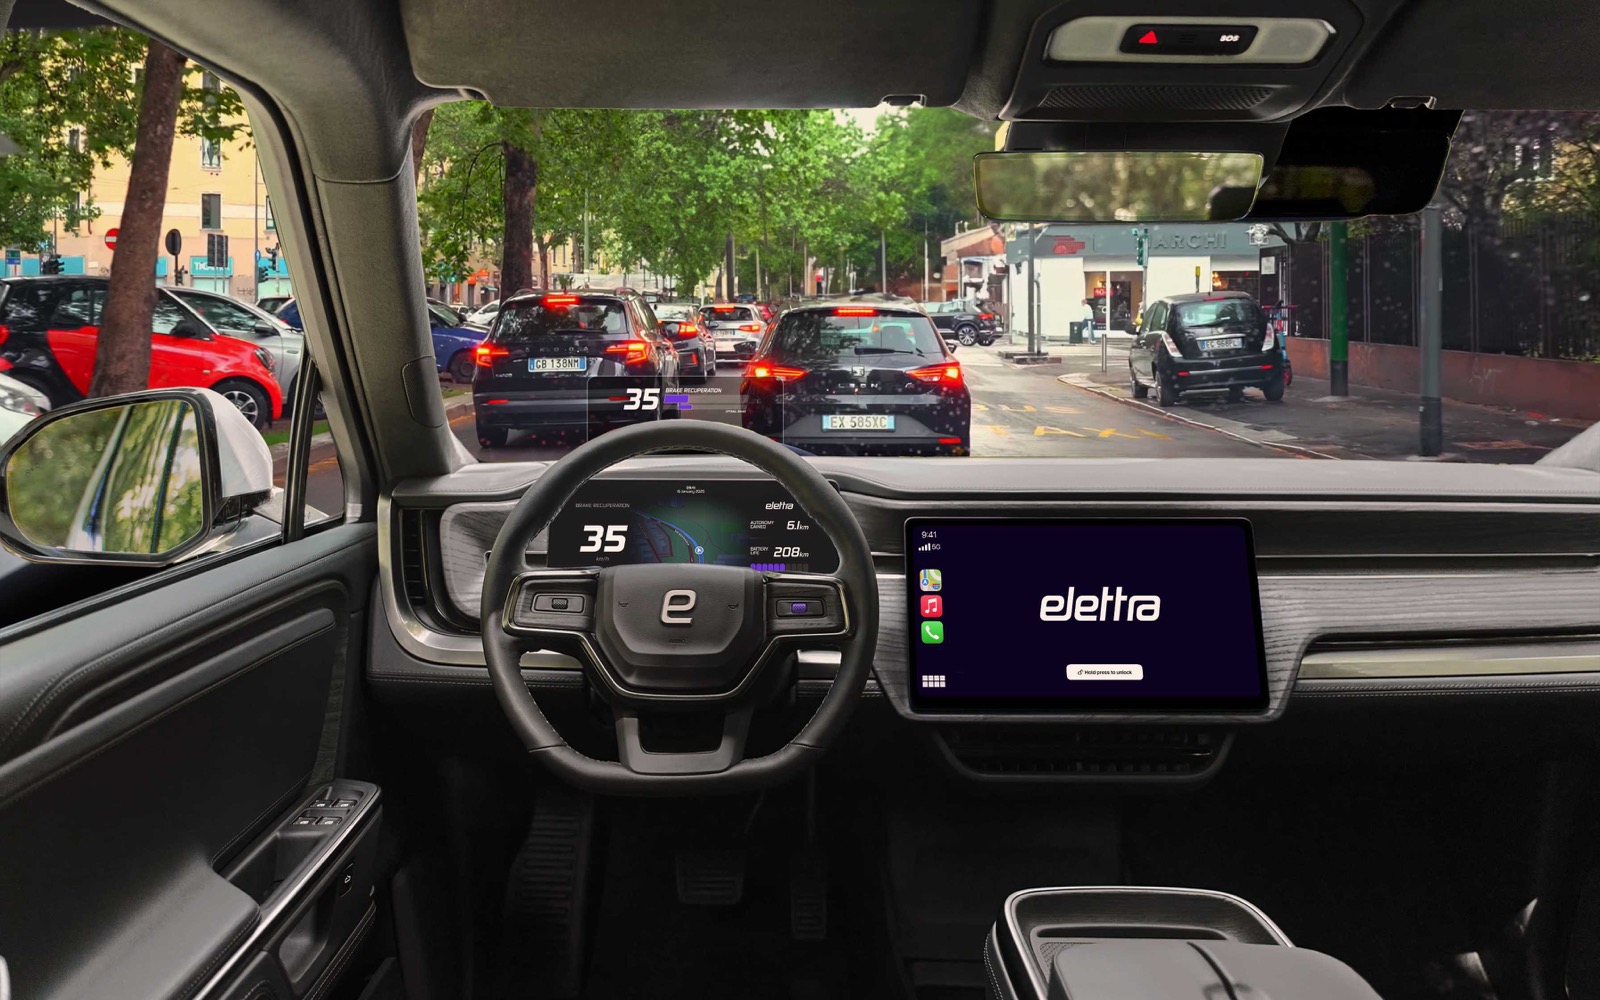
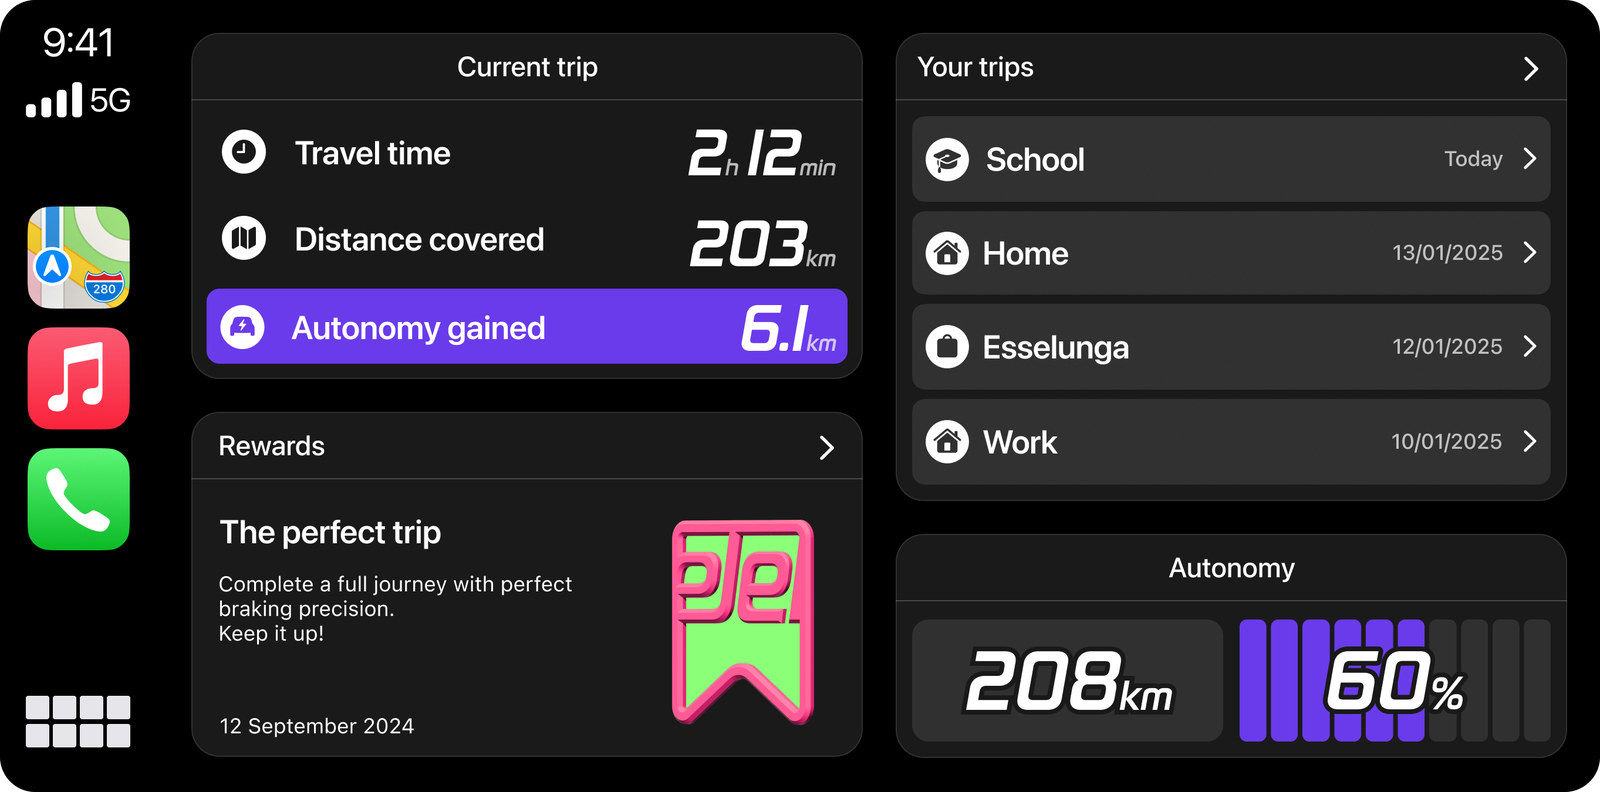
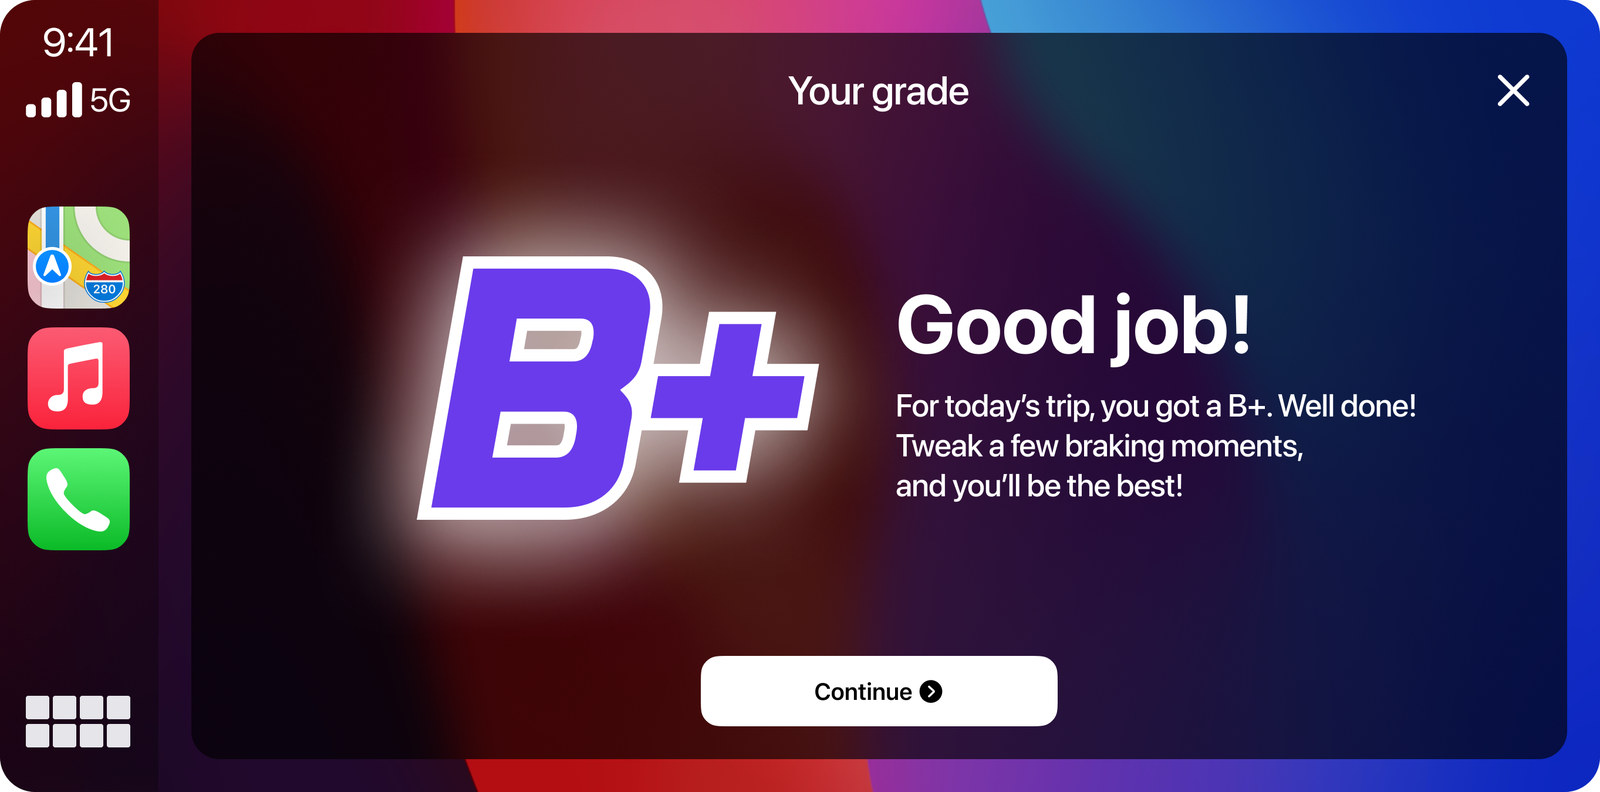
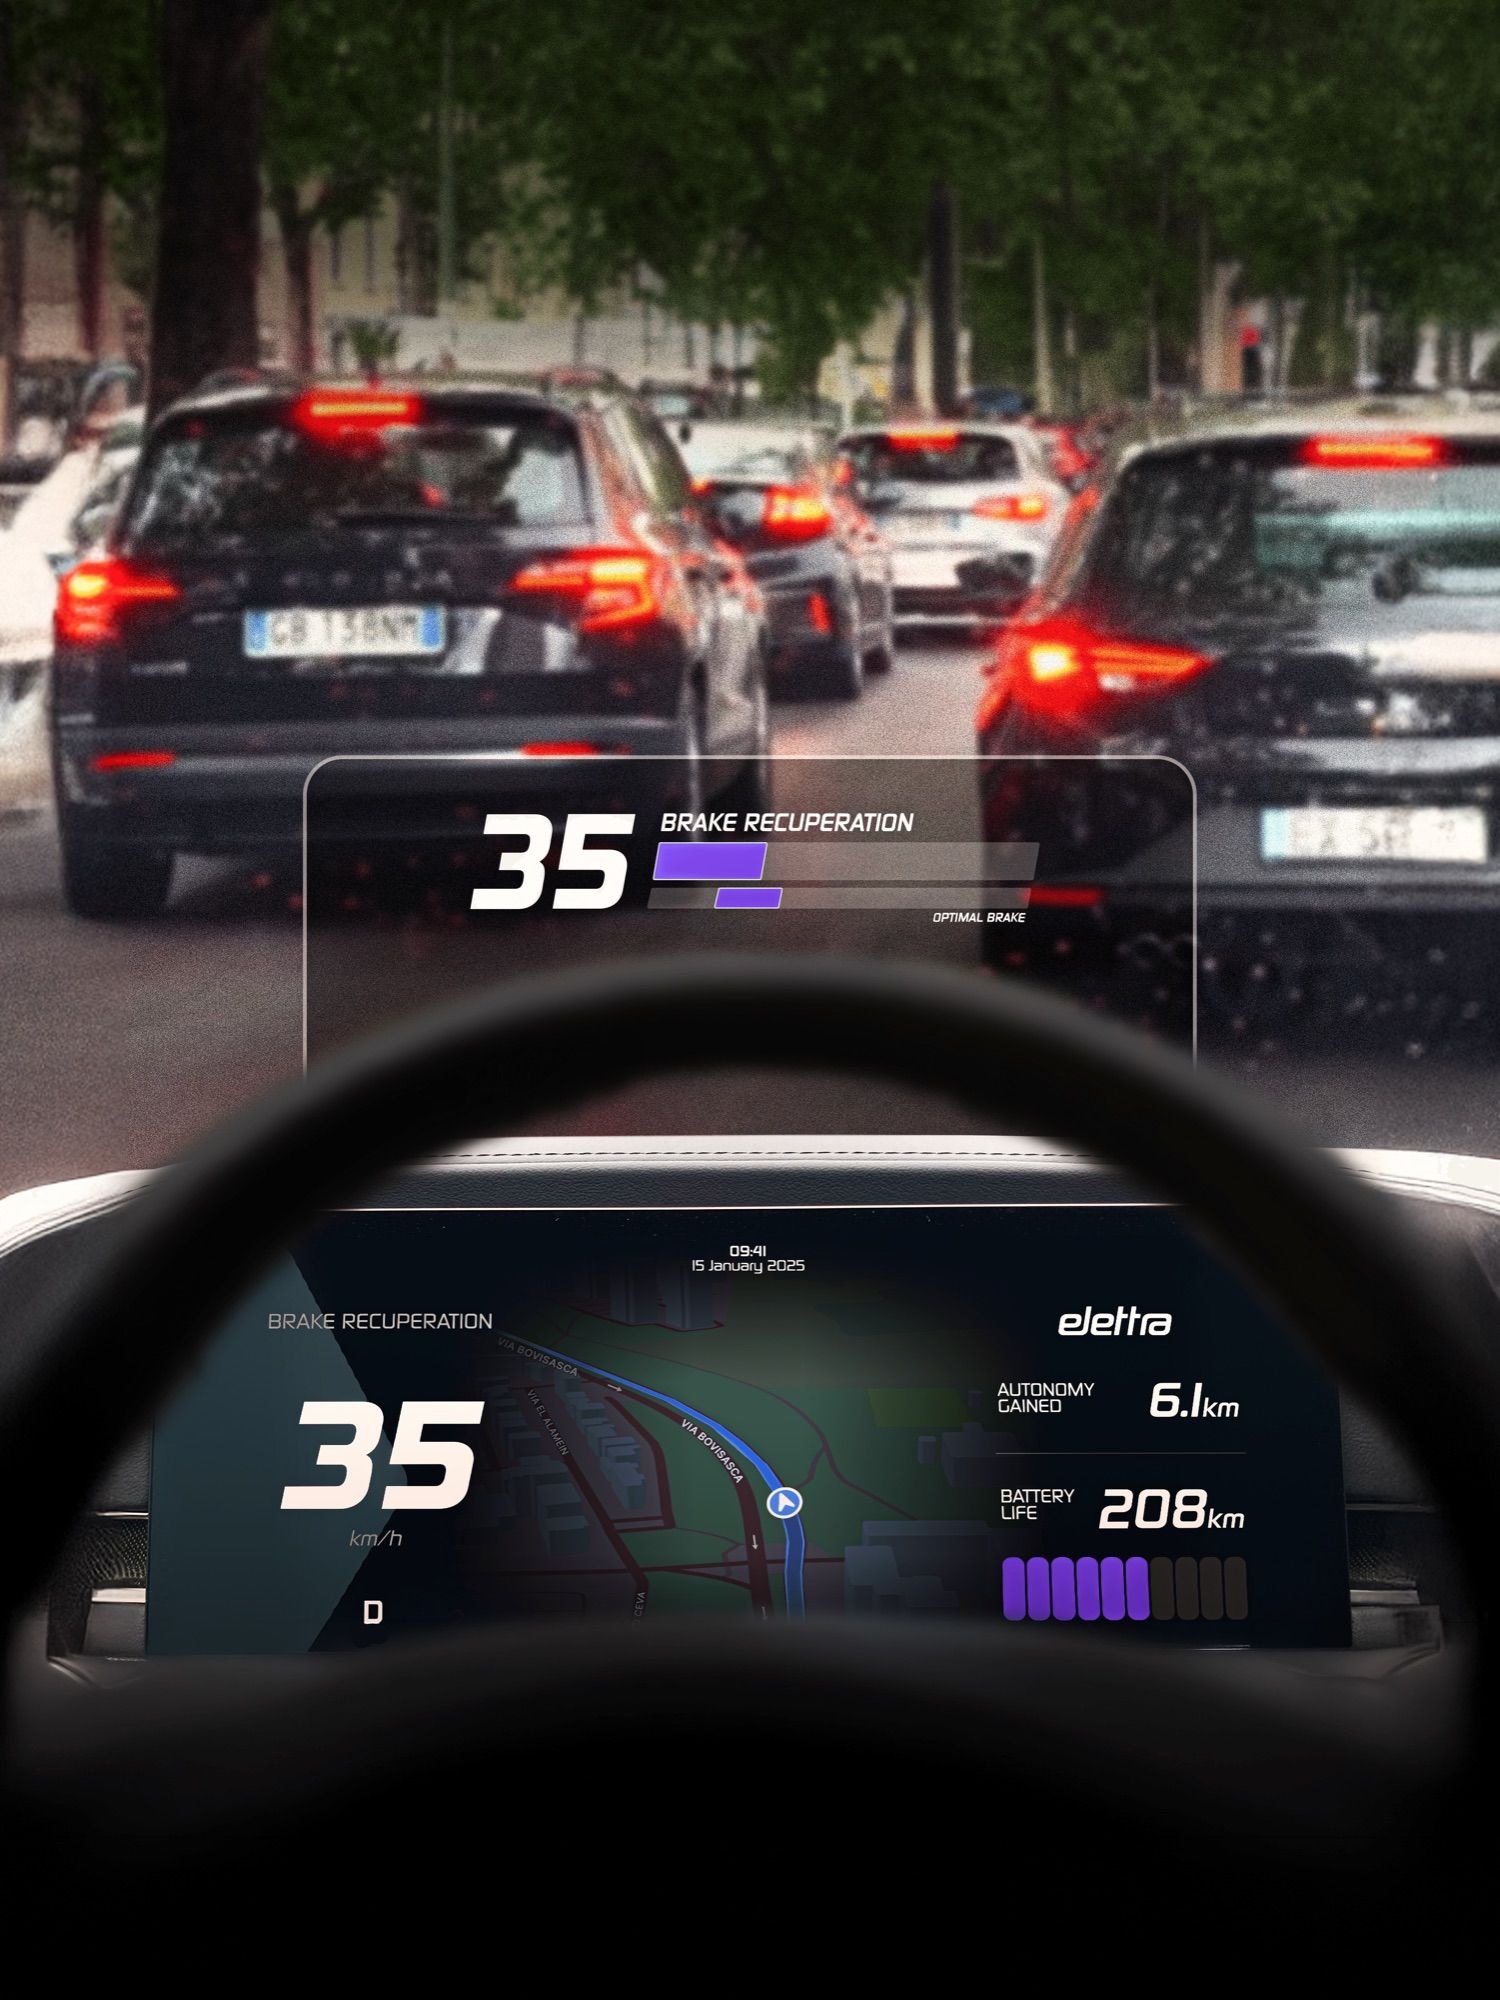
A bar in the head-up display turns purple when the driver brakes inside the optimal zone, where the battery recovers the most energy. Trip summaries and rewards appear on the central display once the car is parked.
The solution
A bar in the head-up display shows how well you are braking.
While you accelerate, the bar is white and rises with your speed. When you brake correctly, inside the optimal zone where the battery recovers the most energy, your speed drops gradually and the bar stays purple. When you brake badly, your speed drops faster and the bar turns red.
Research
Electric cars need a different way of braking, and nothing in the car teaches it.
Italdesign asked us to imagine the compact car of 2035. To understand where electric cars leave their drivers alone, we studied how they recover energy and how today’s cockpits present it, then asked the drivers themselves.
“It is unclear what the car is trying to tell me; the interface is confusing.”Questionnaire respondent
The answers pointed to the same gap. An electric car sends energy back to the battery when it brakes, but nothing tells the driver how to brake to recover more, so the numbers on the dashboard stop making sense and drivers stop trusting them.
This is why we chose the Energy-Aware Driving scenario: a car that shows, in real time, when energy is being used and when it is being regenerated, and suggests how to drive more efficiently. It applies to every trip, for as long as someone owns the car.
The research gave us two personas. Renzo’s fear fades within weeks of owning the car, while Lucia’s habits stay with her for years, so we designed for Lucia and made sure the system also reassures Renzo.
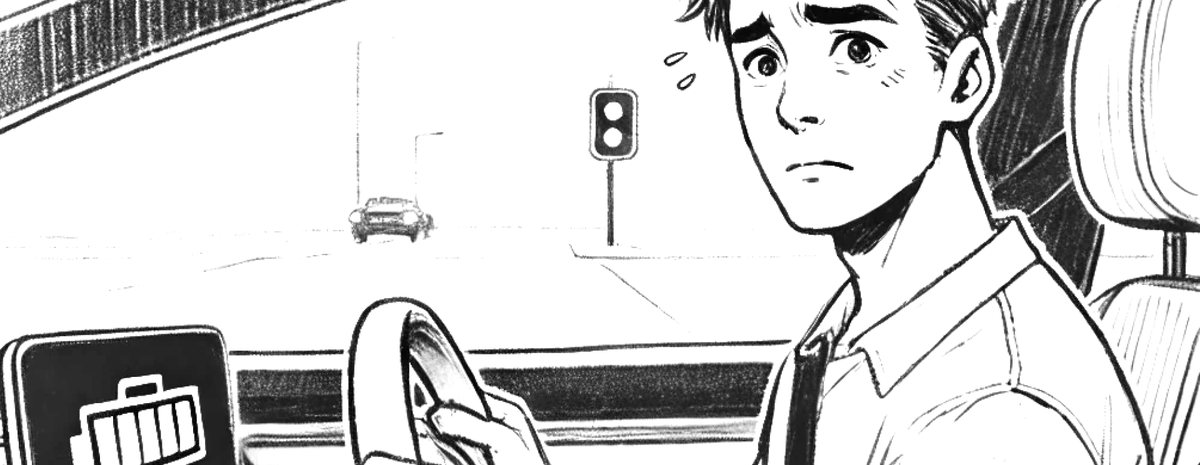
Renzo
A new electric car driver, afraid of running out of charge.
Pain points- Feels uneasy leaving home without a full battery
- Finds it hard to trust the car’s estimated autonomy
- Worries about finding available charging stations
Reliable information on remaining autonomy.
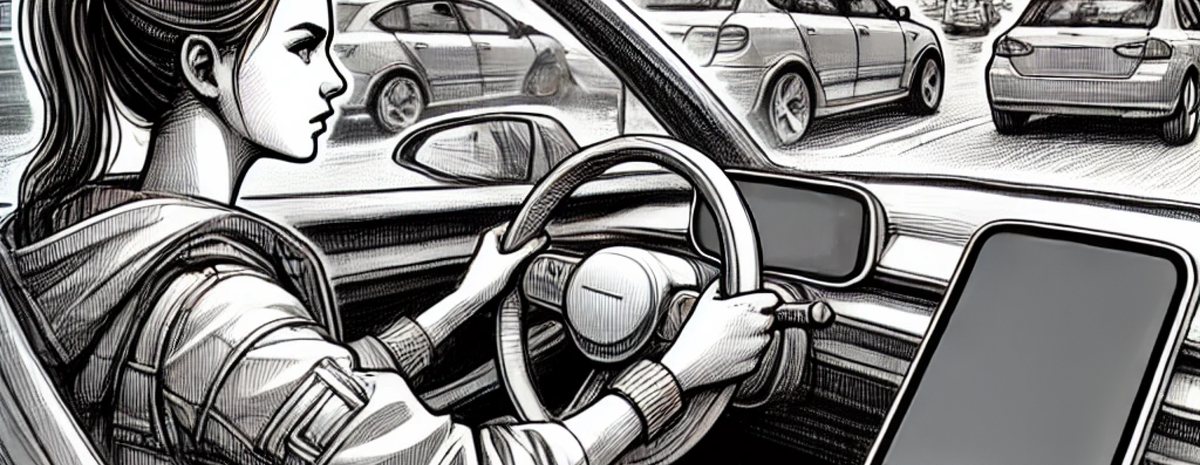
Lucia Our focus
Bought an electric car to spend less, and drives it the way she drove her old petrol one.
Pain points- Has trouble trusting the car’s information because range estimates are inconsistent
- Her driving habits stop her from saving as much as her EV allows
A way to adapt her driving habits to save resources.
How might wehelp EV drivers understand and improve energy recovery while driving, without taking their attention off the road?
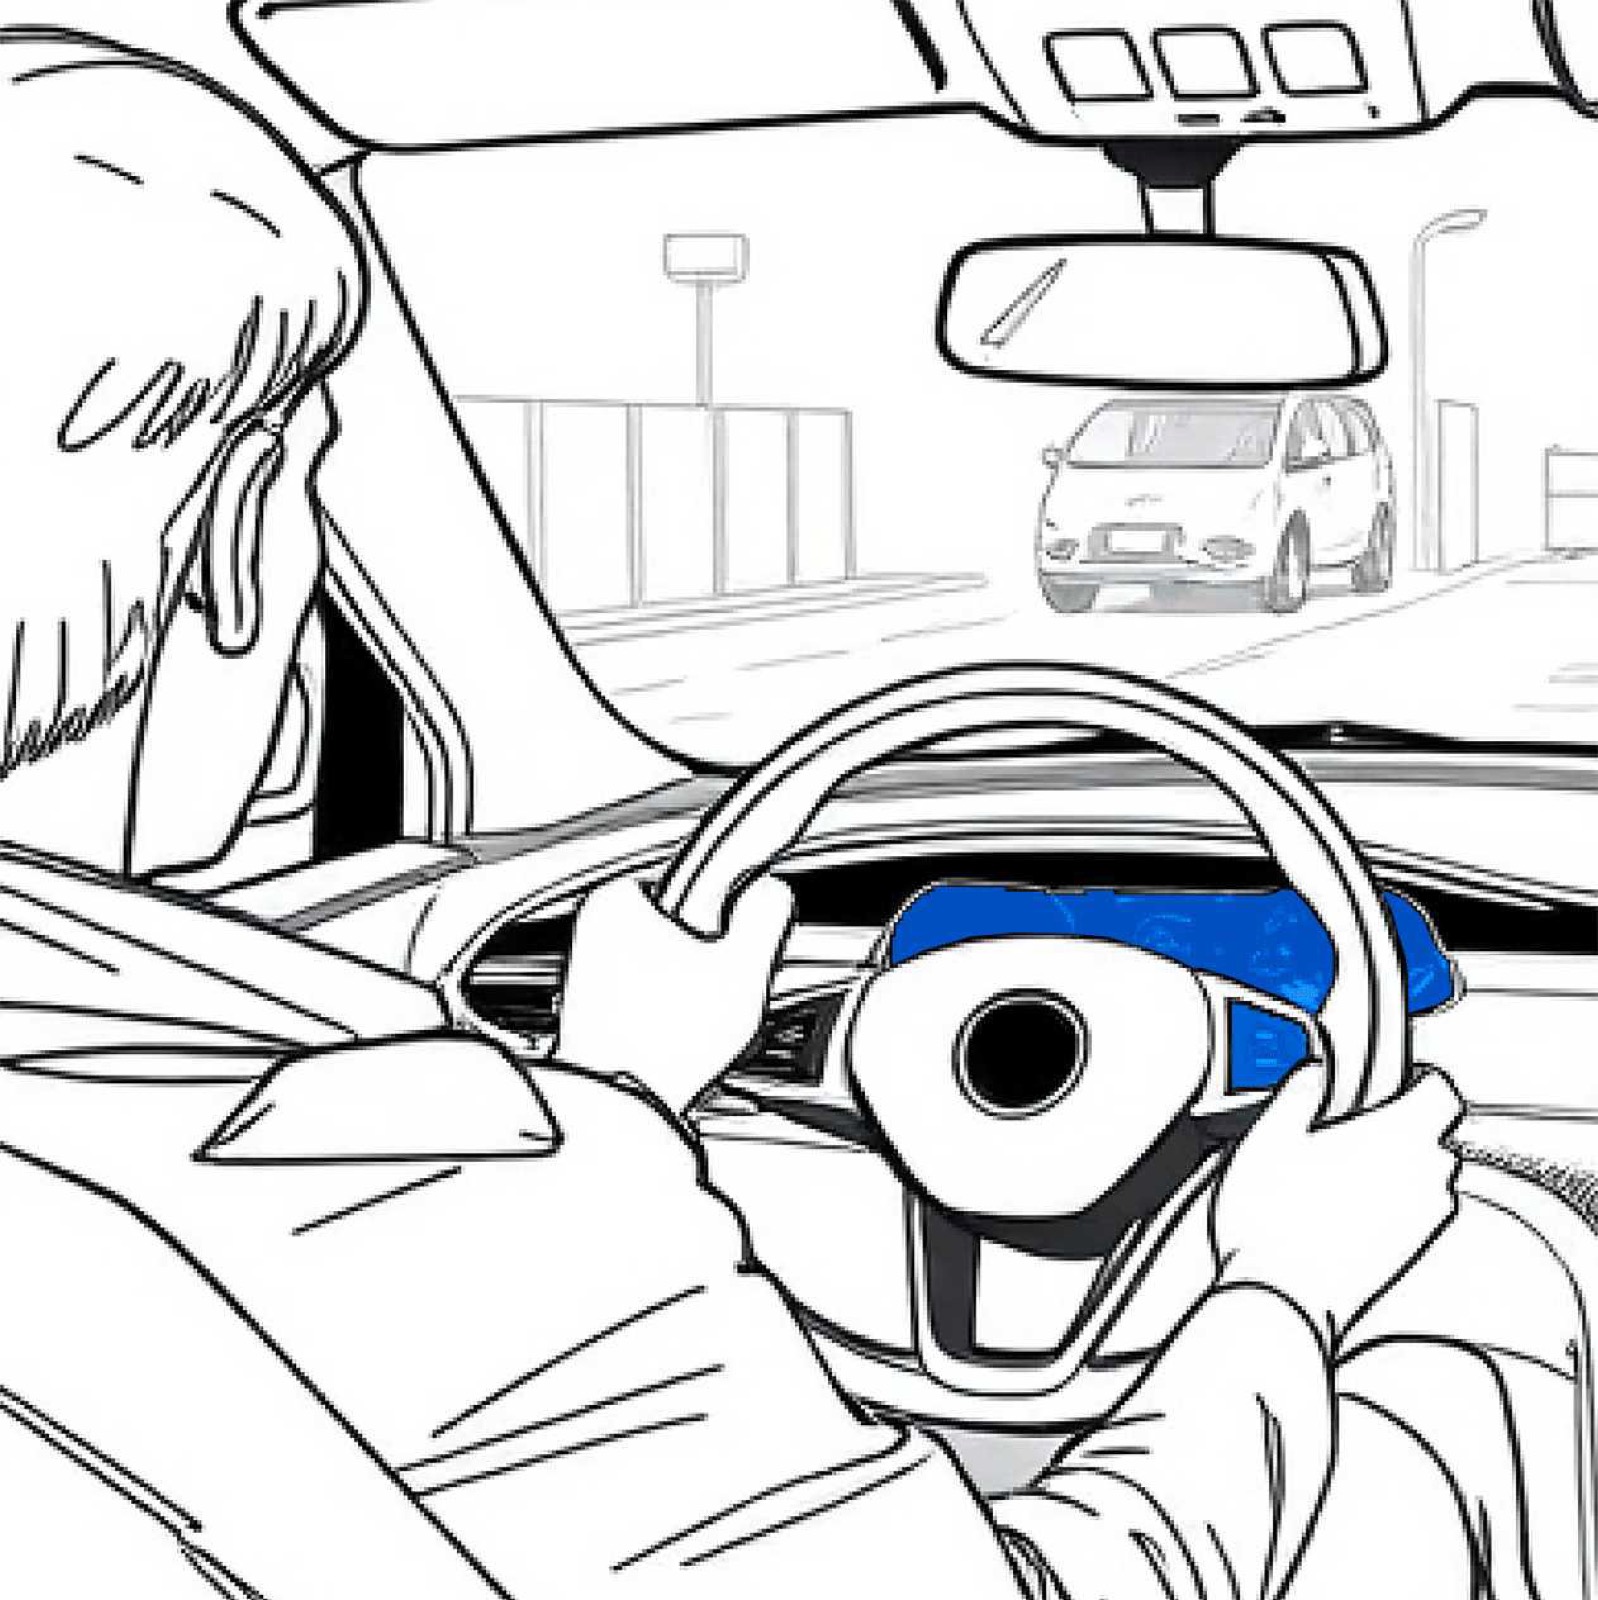
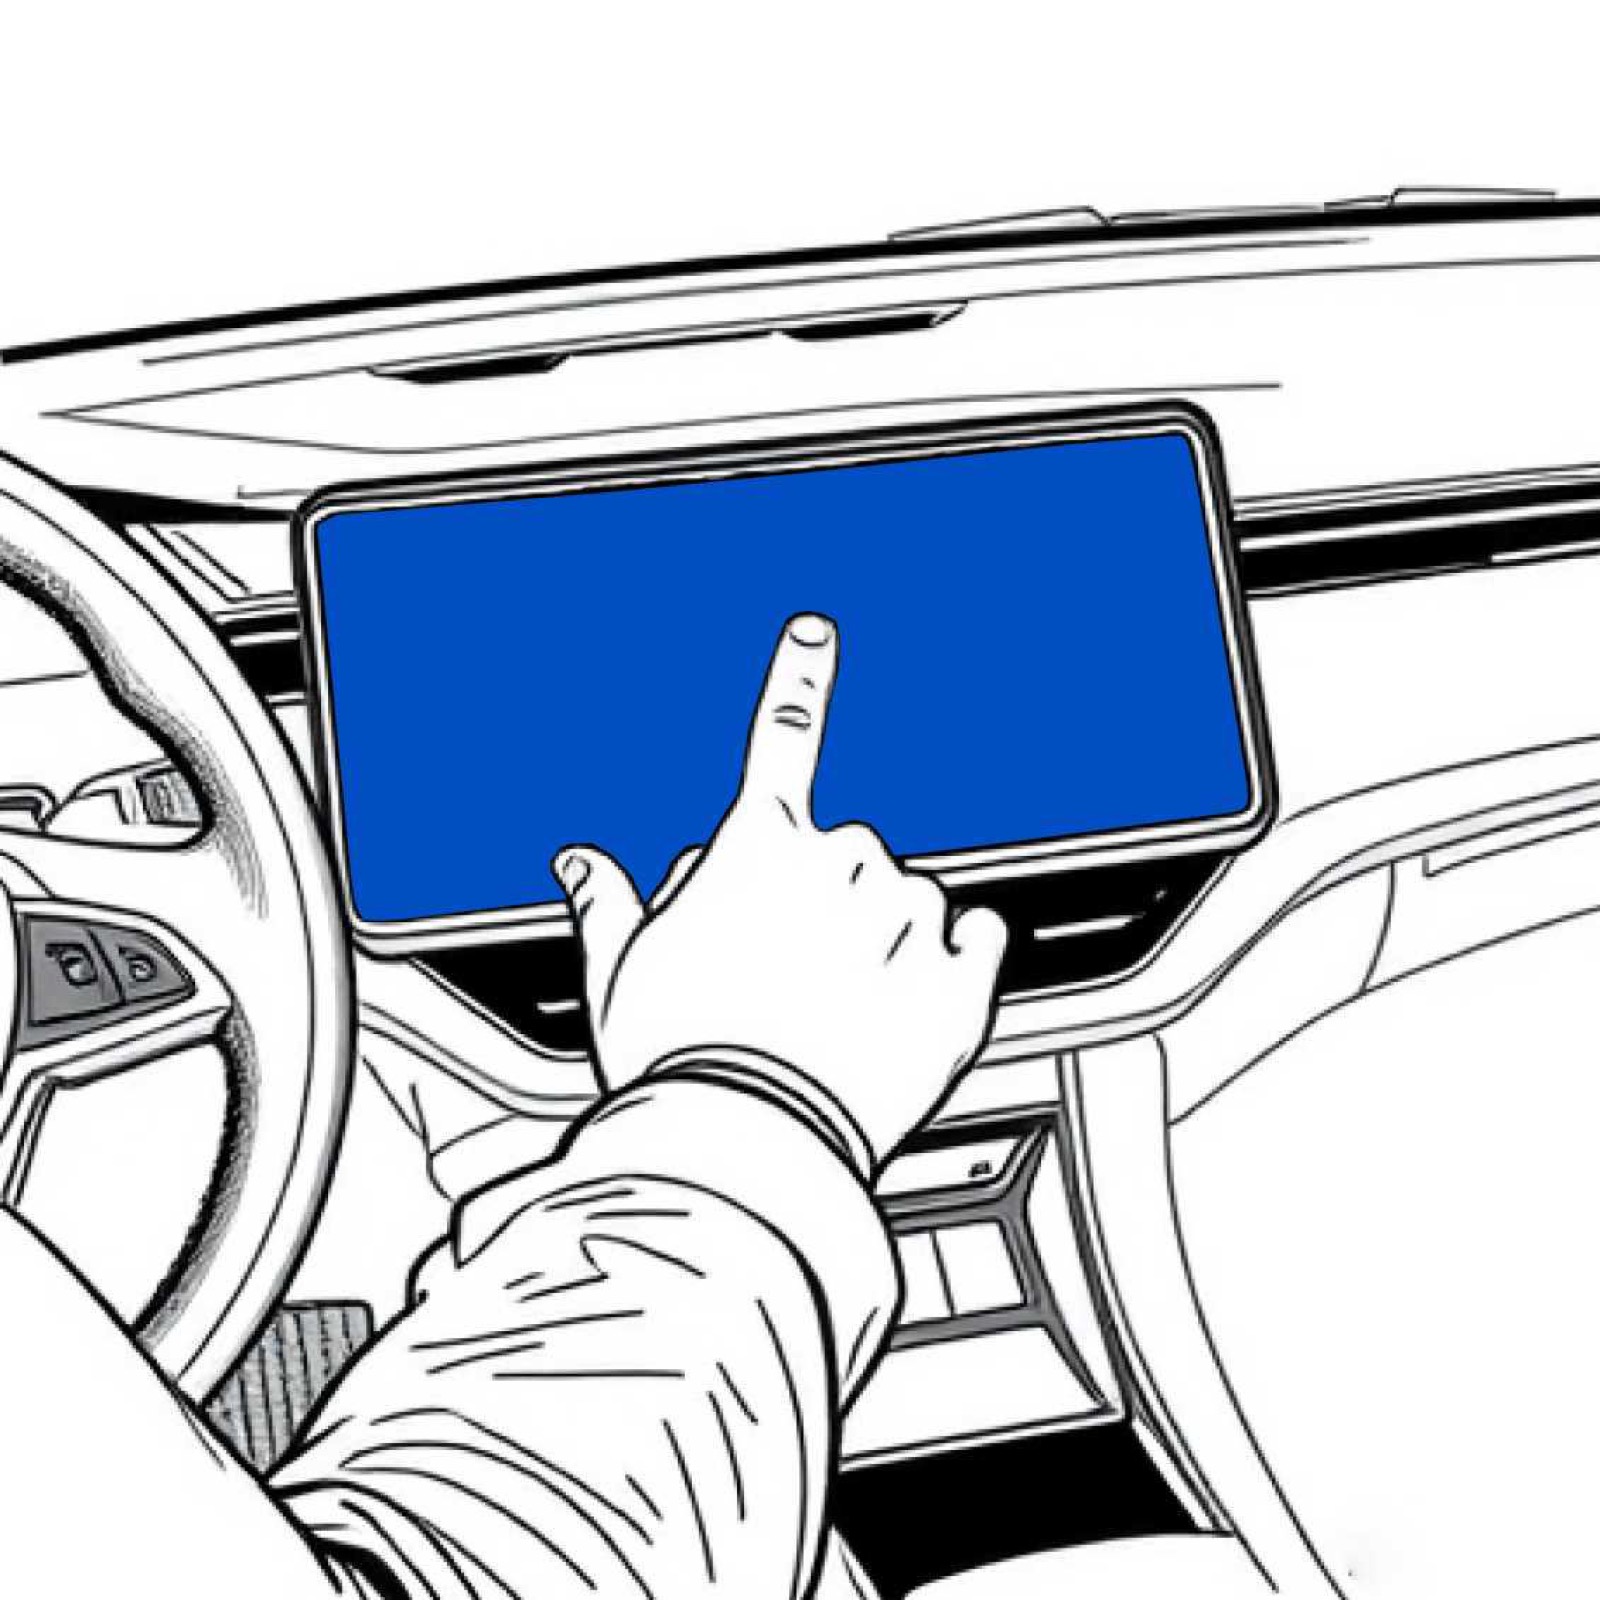
Our first answer had four parts: a haptic brake pedal, a cockpit showing the optimal speed range, a companion app and “Elettra”, a light that changes with your driving style. But what Lucia needs is to know how to brake while she is braking, and the cockpit can show exactly that. So we focused on the cockpit.

Testing
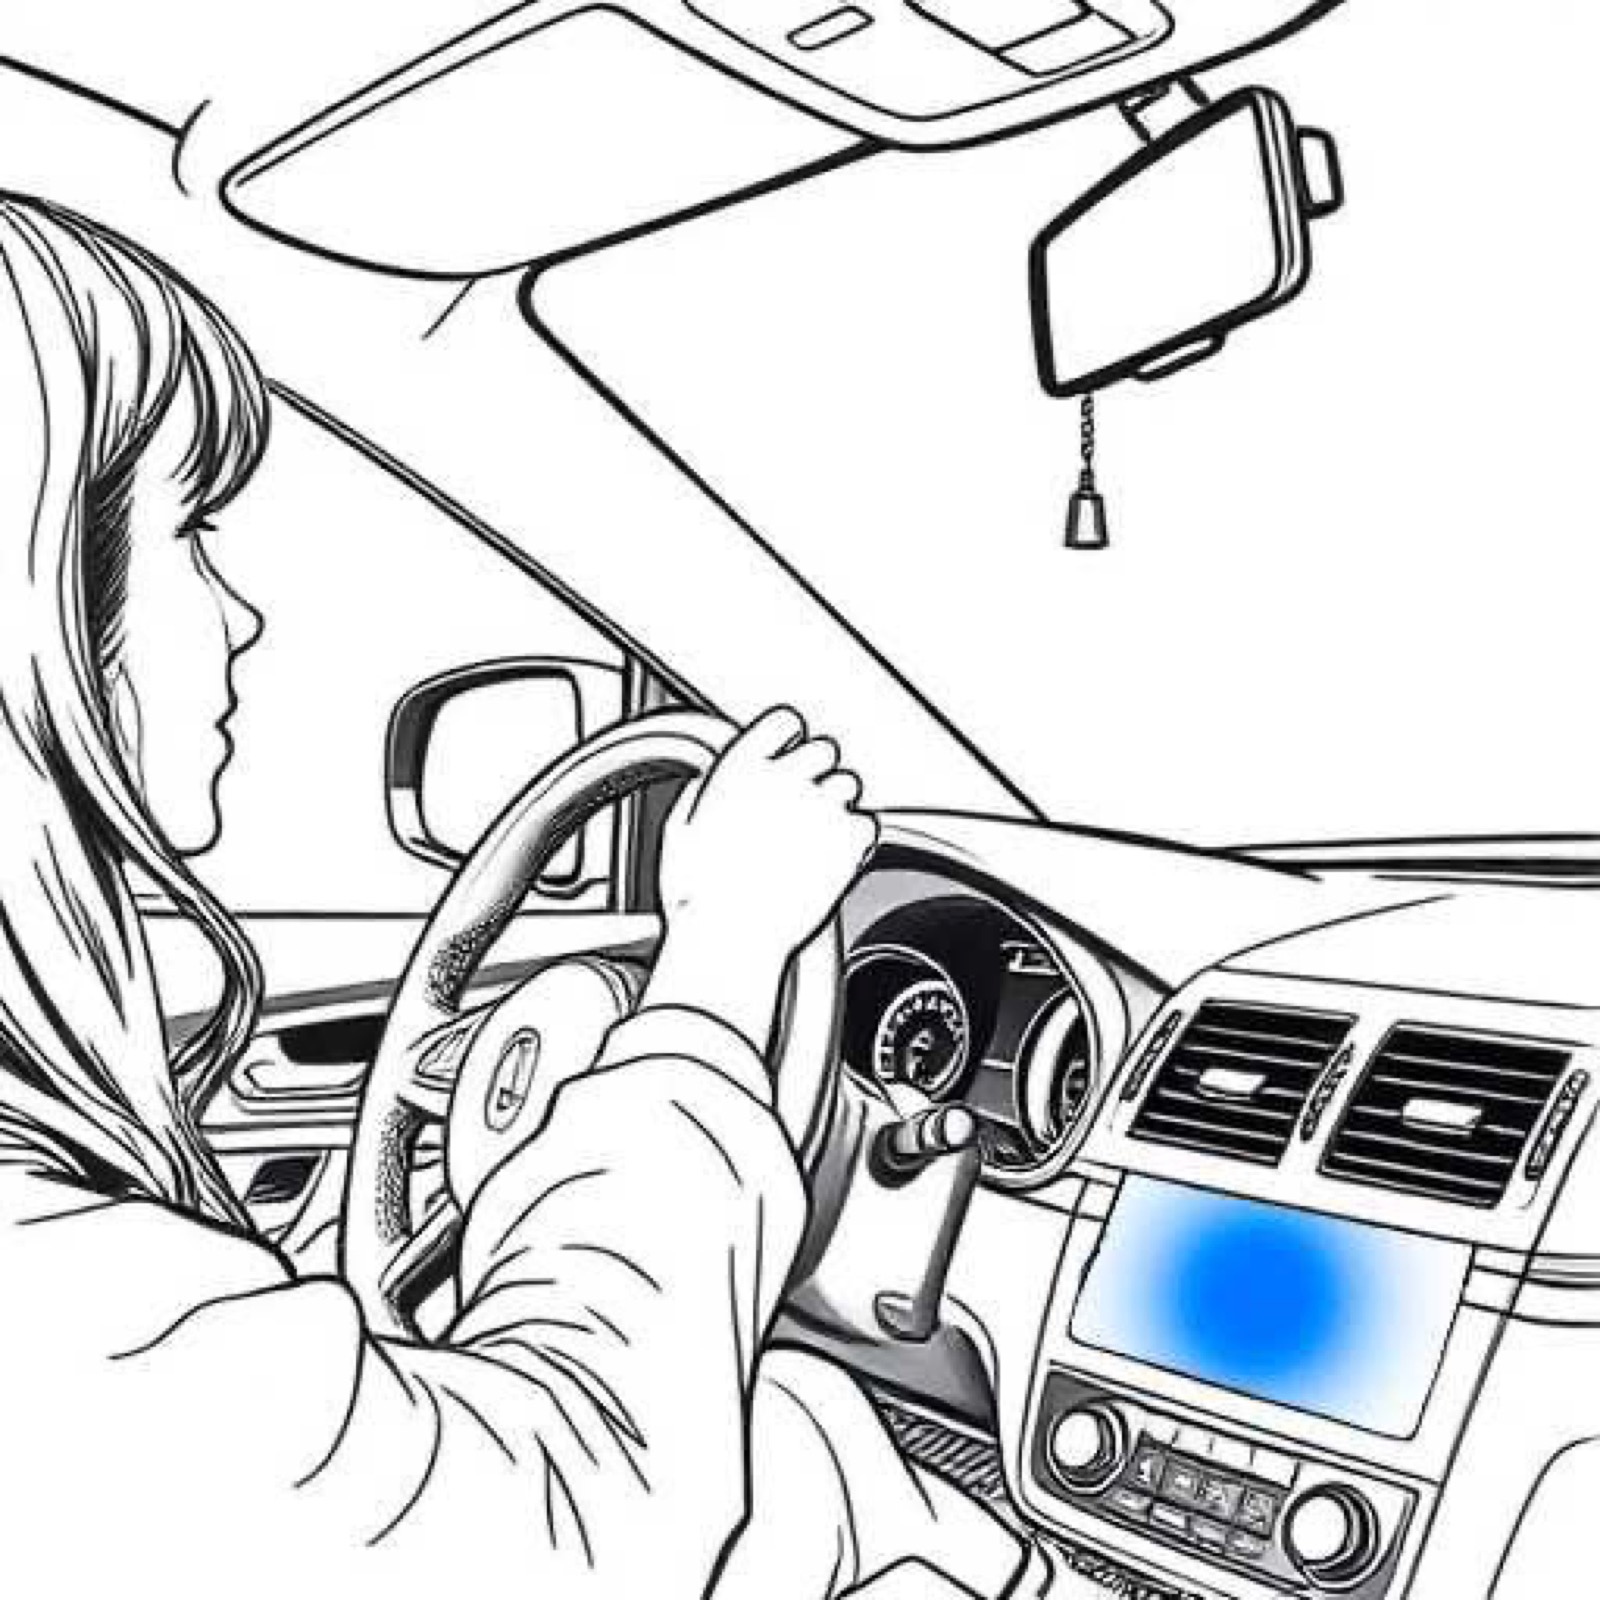
We tested the feedback twice: first on a screen, then behind a wheel.
To find the feedback that made it clearest how to brake to recover the most energy, we built six small driving games in p5.js. You press Enter to accelerate and Space to brake, and you have to stop before the car in front. The road and the physics were the same in every game; only the feedback changed.
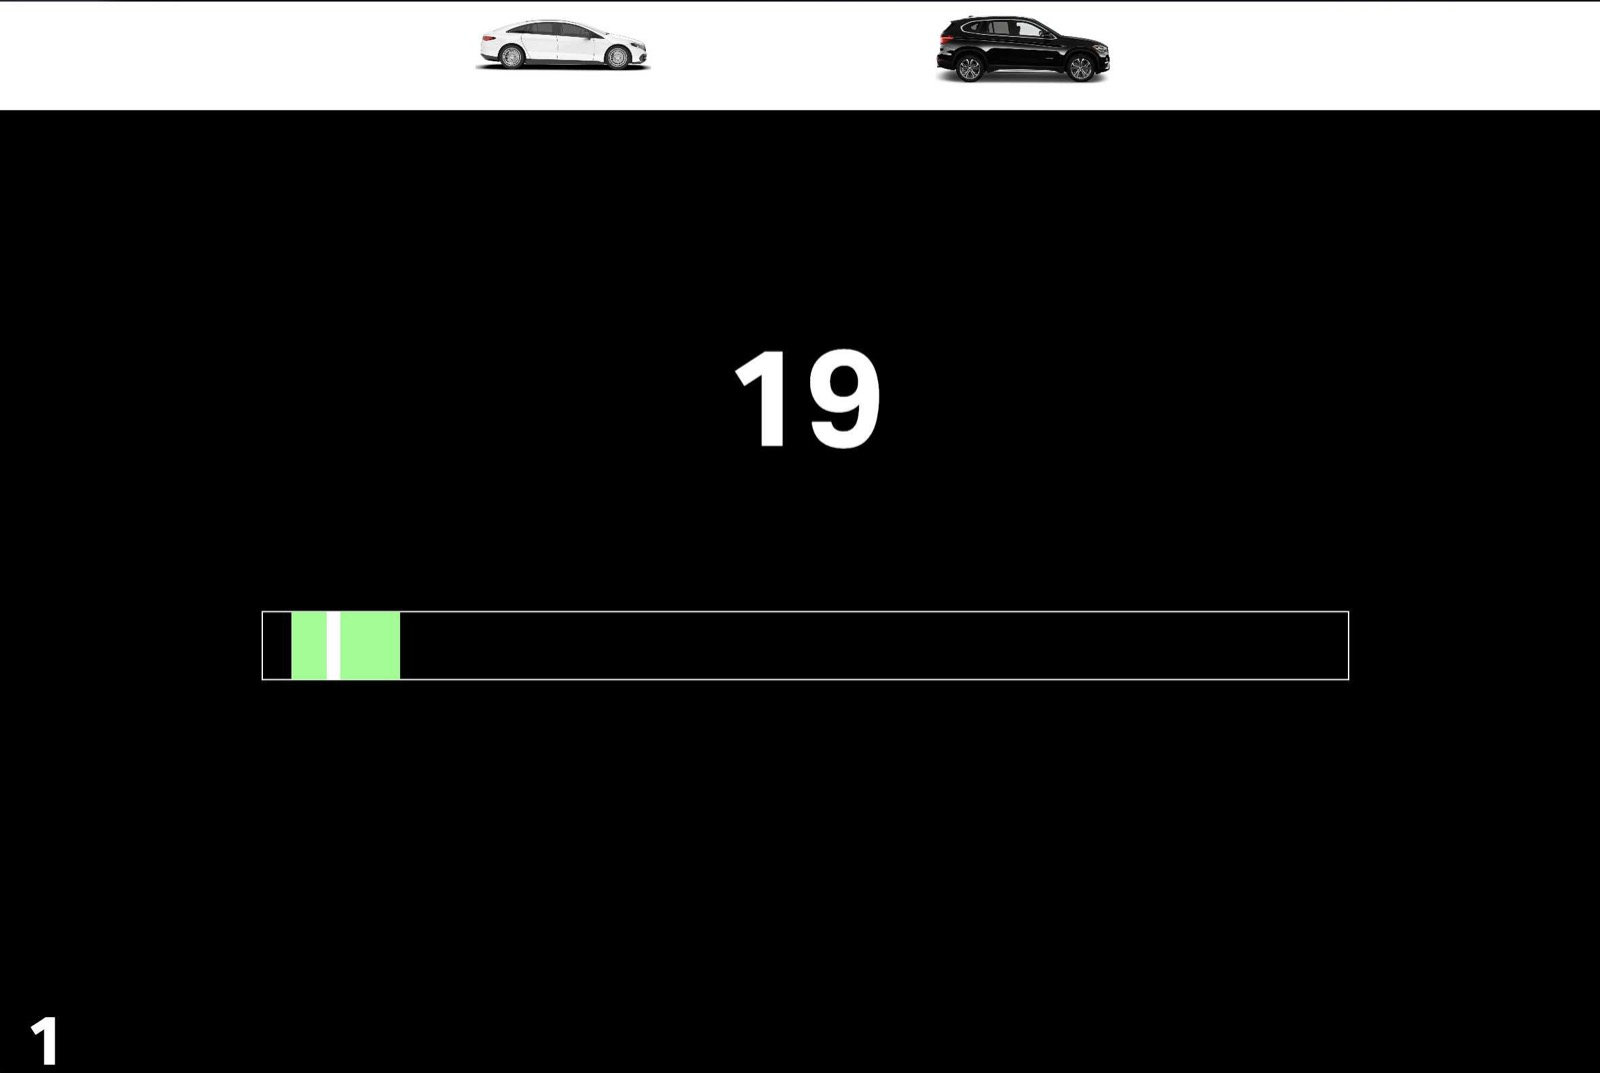
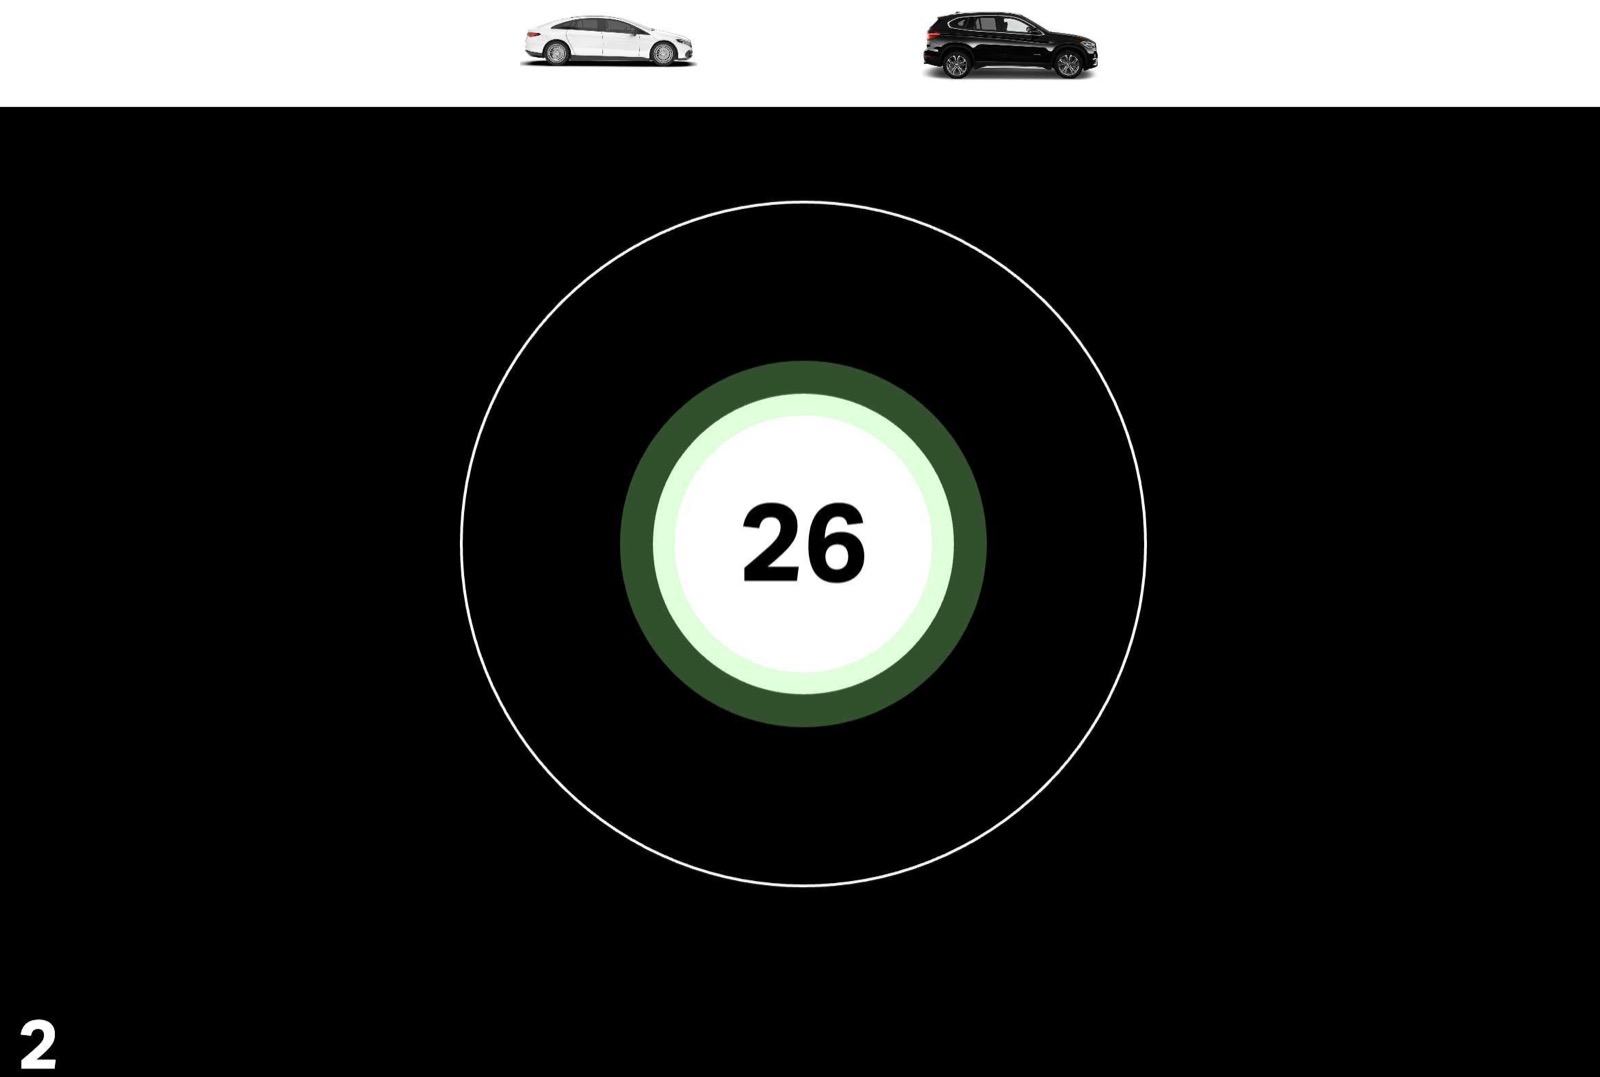
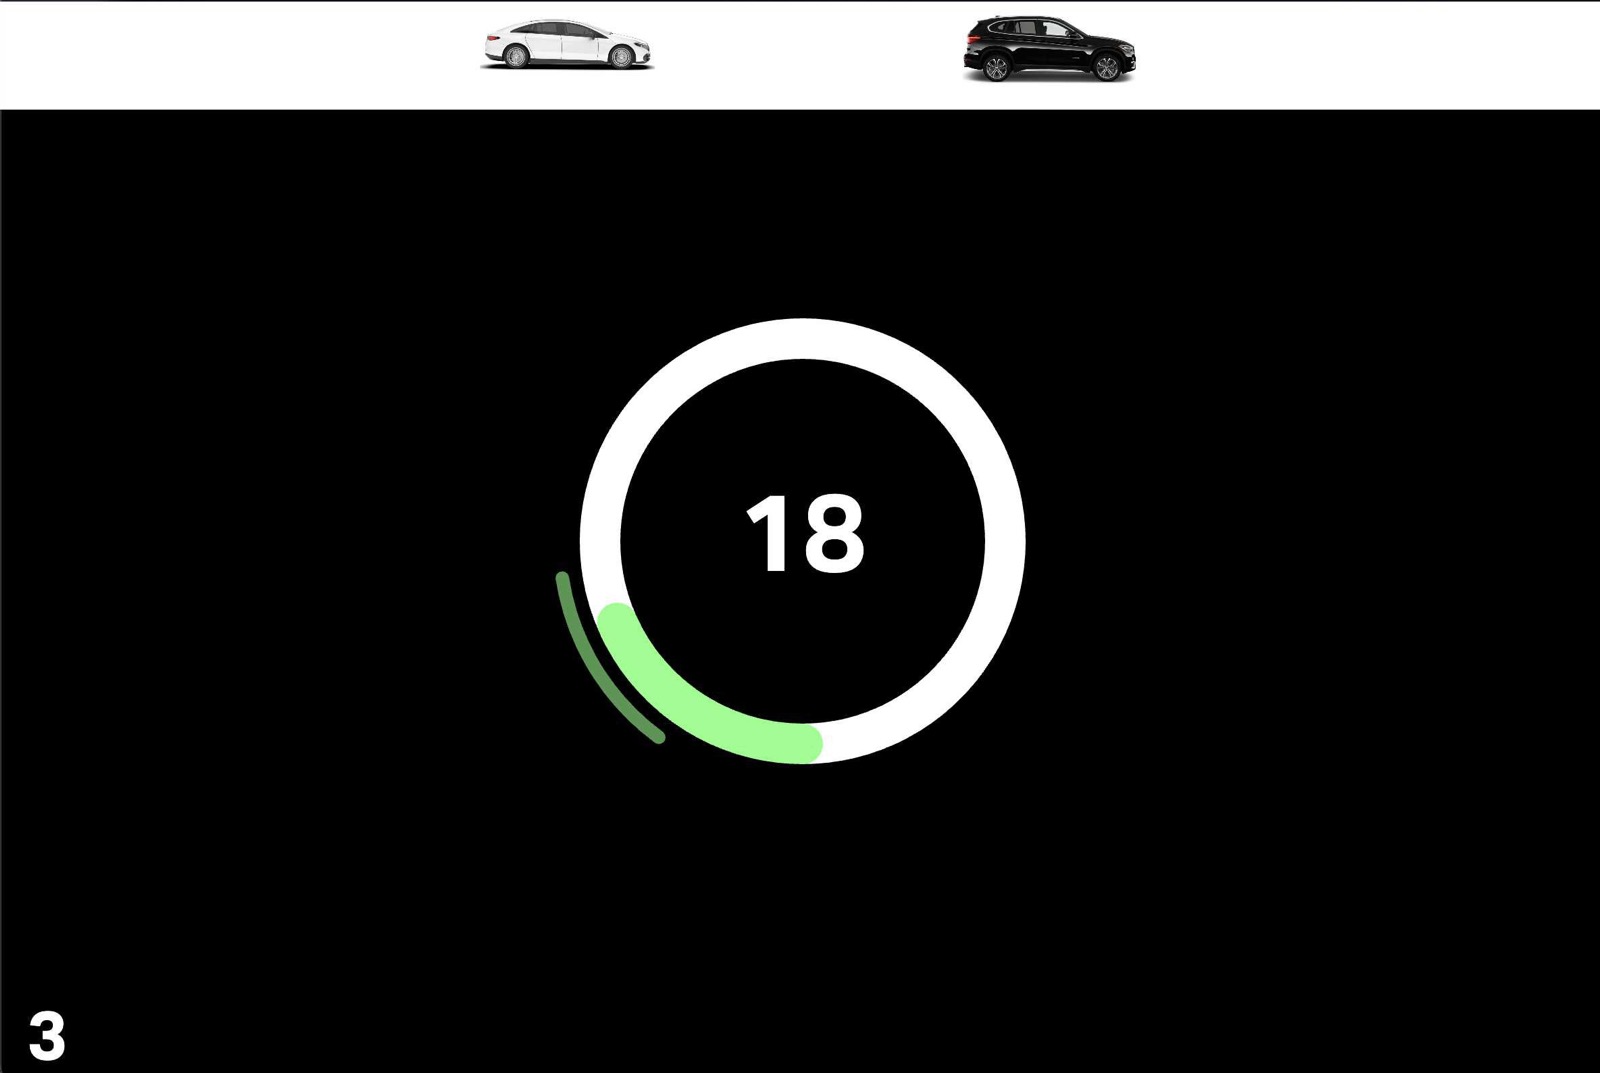
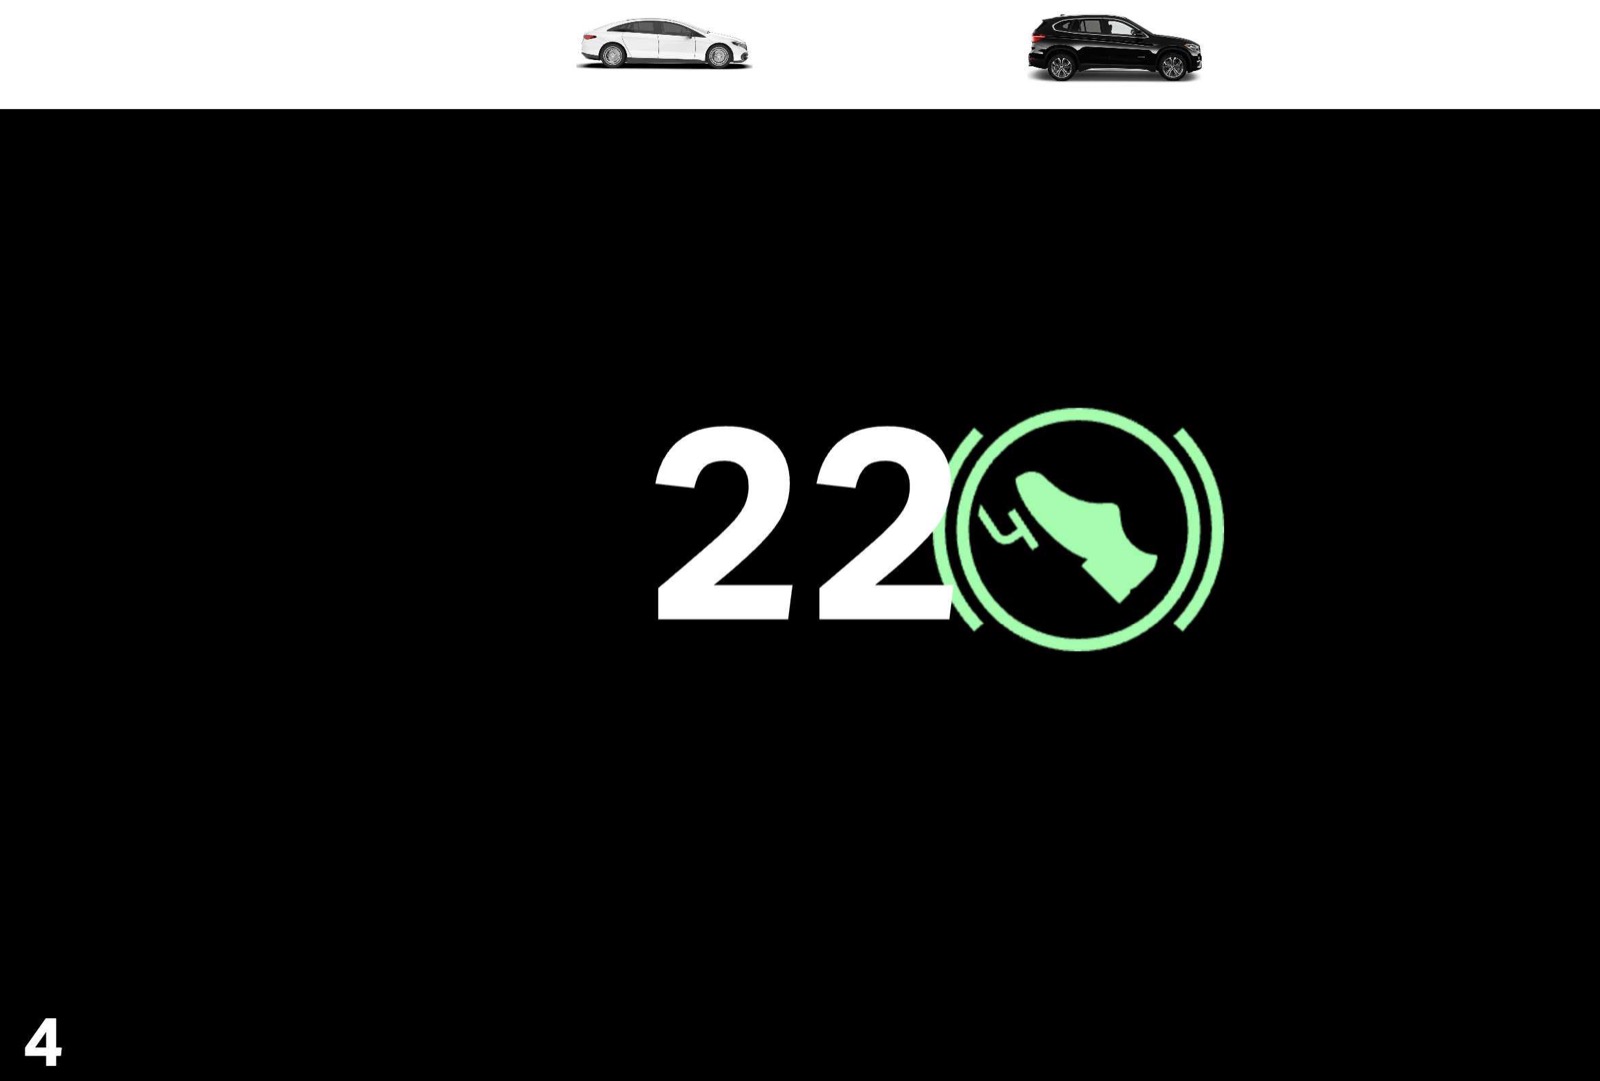
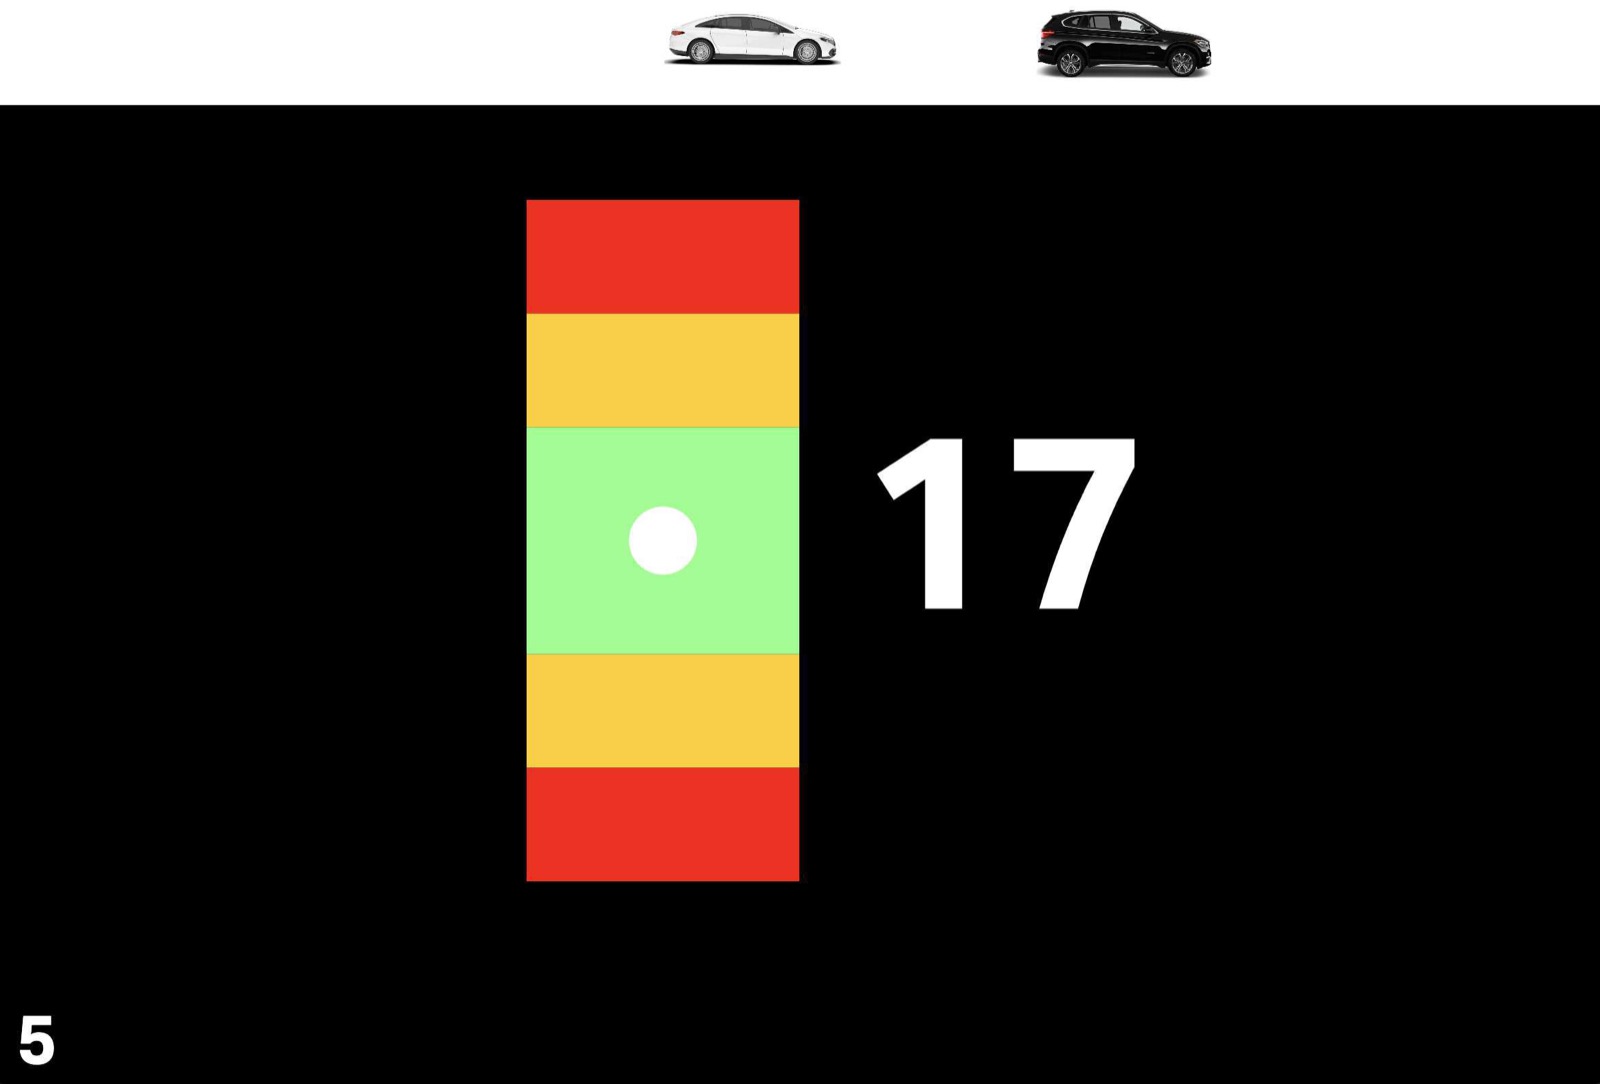
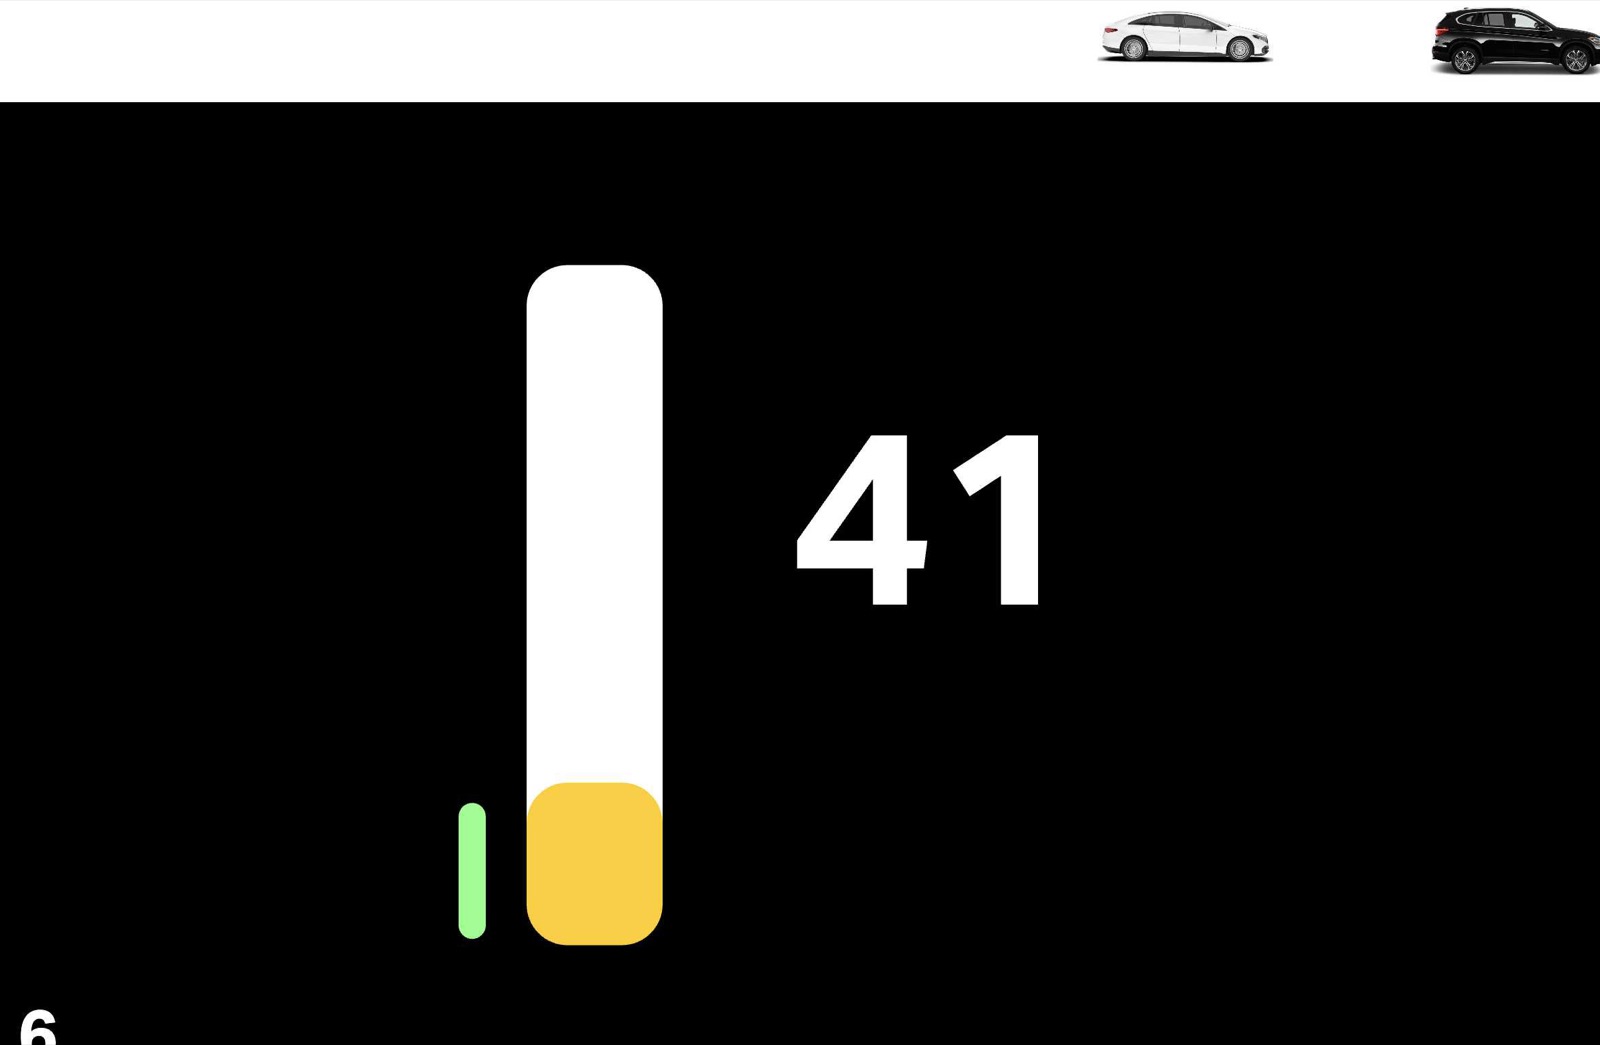
Testers picked number 3, a round speedometer with the optimal range on its edge: the shape was familiar and the colour could be read in an instant.
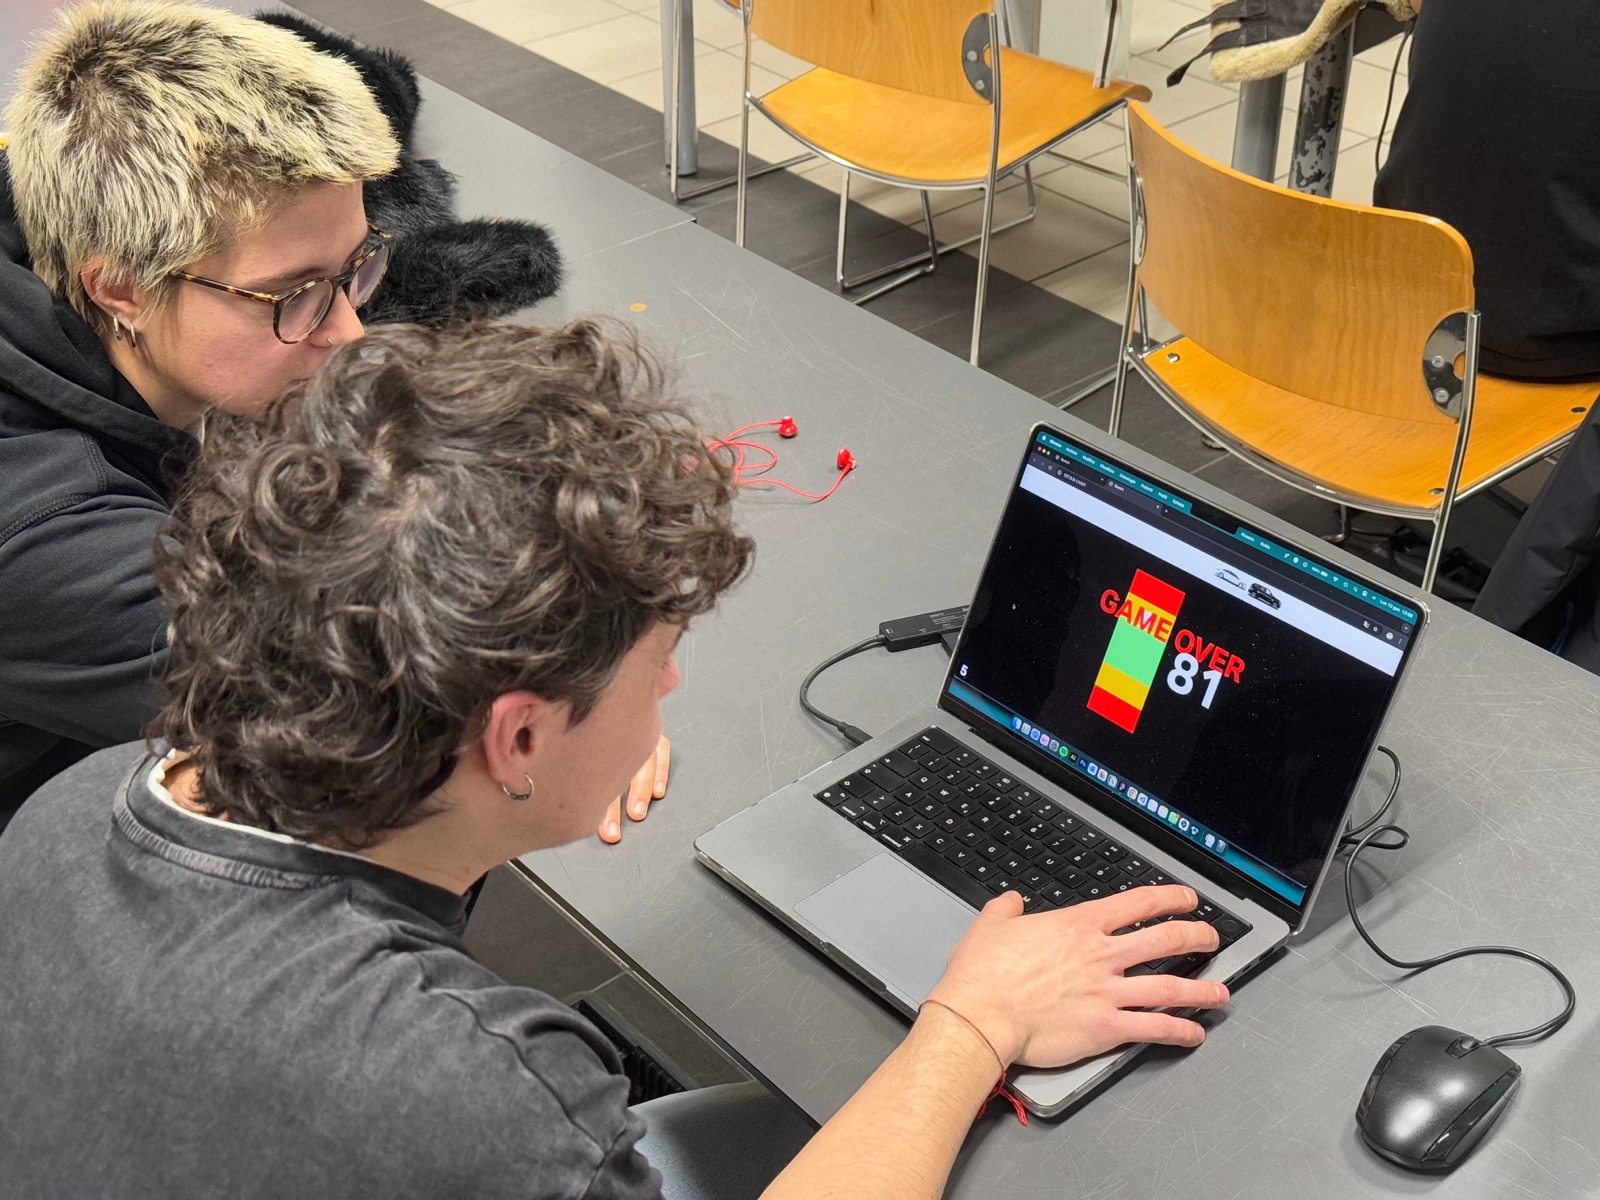
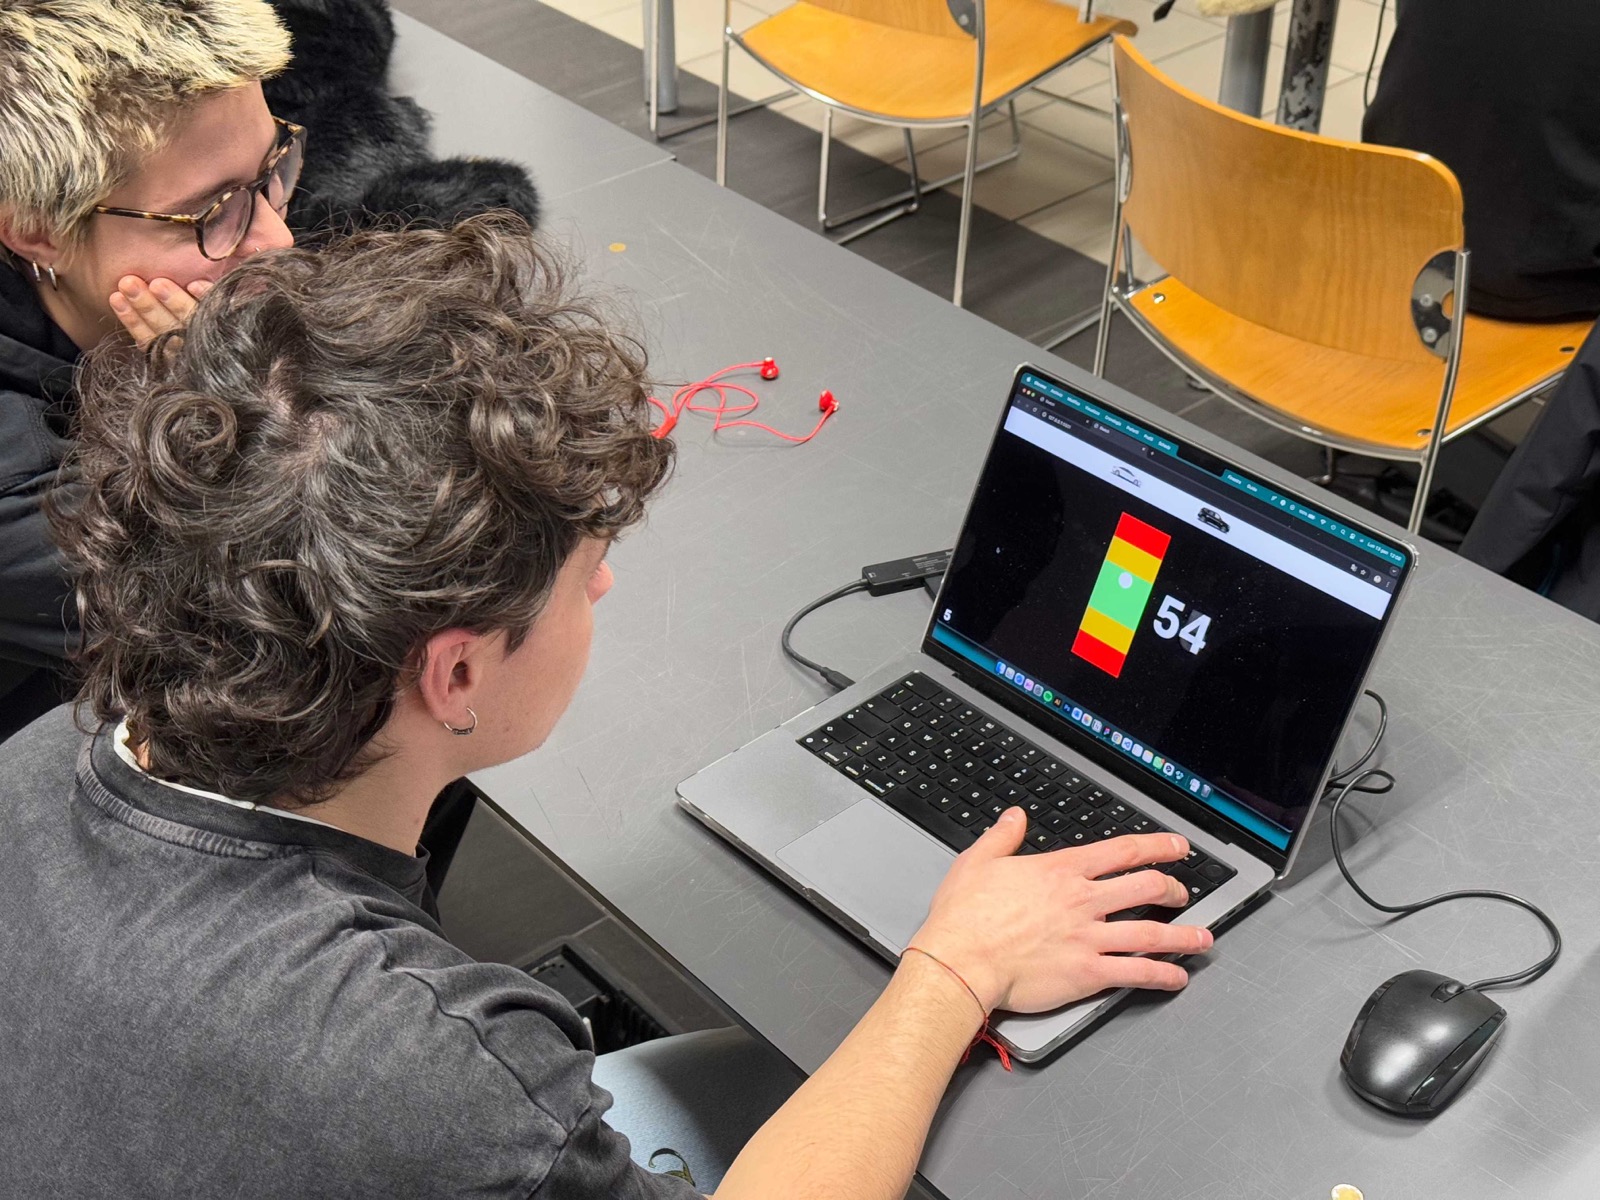
A game on a laptop can’t show what happens while you drive, so we built a simulator with the cockpit behind the wheel, the central display at the side and road video in front, and watched people drive it.
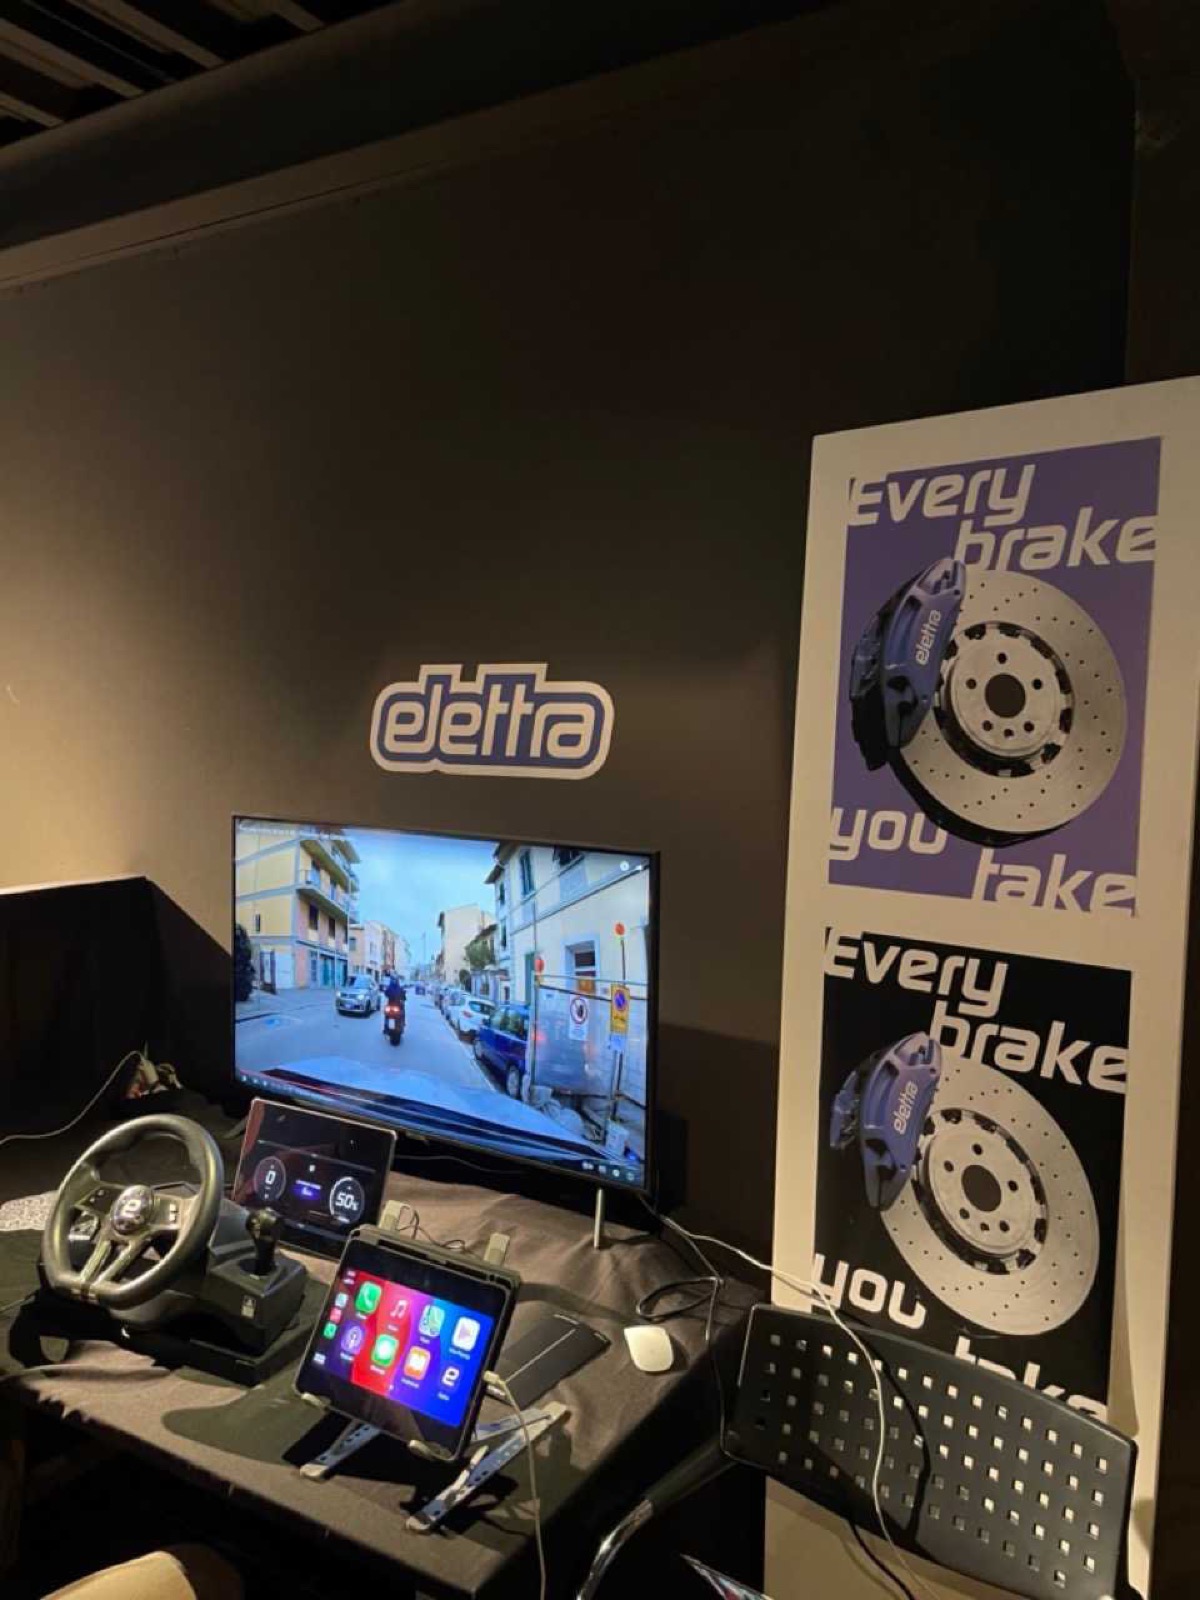
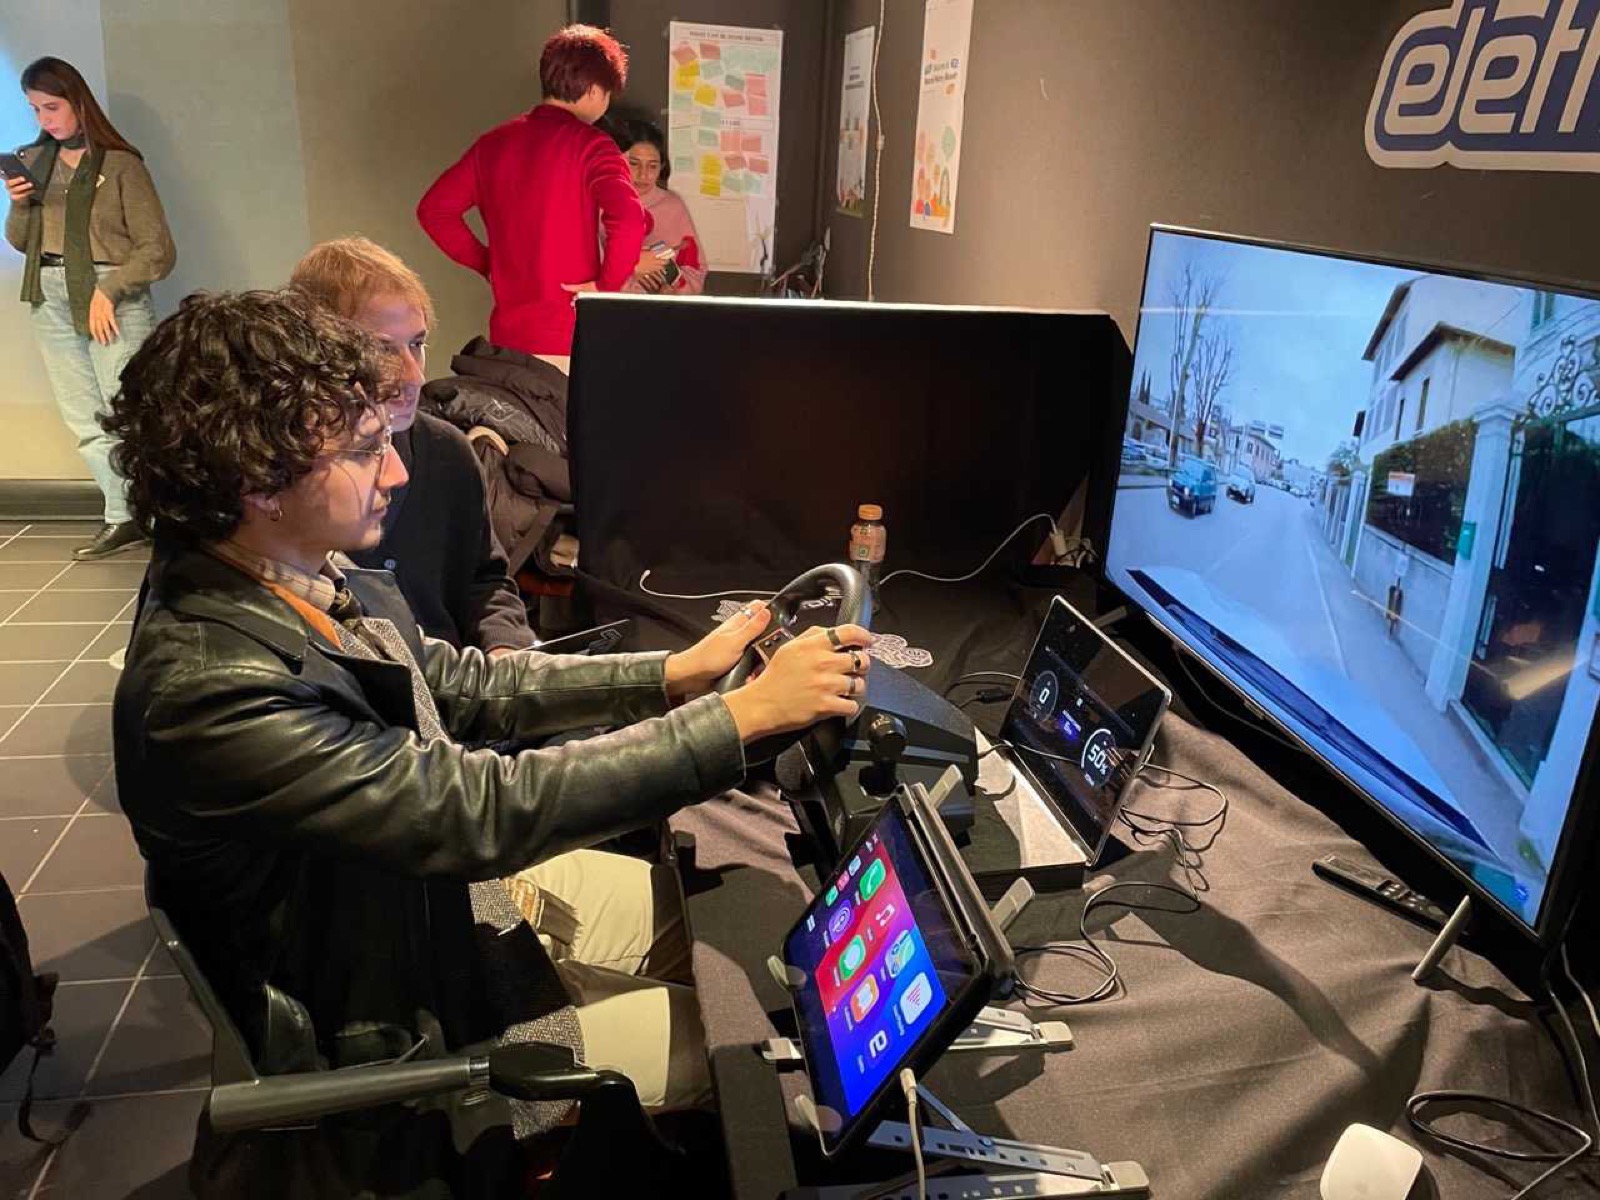
Driving changed what we had learned on screen.
What we saw
What we changed
Drivers looked down at the speedometer to check their braking.
We moved speed and braking feedback into the head-up display.
We had first added a “perfect brake” sound, and everyone found it annoying.
We removed the sound. The bar and the Elettra logo now turn purple instead.
We had first used two levels, “perfect” and “acceptable” braking, and people confused them.
We kept a single optimal zone.
With the unrealistic pedals, nobody could hold 100 km/h.
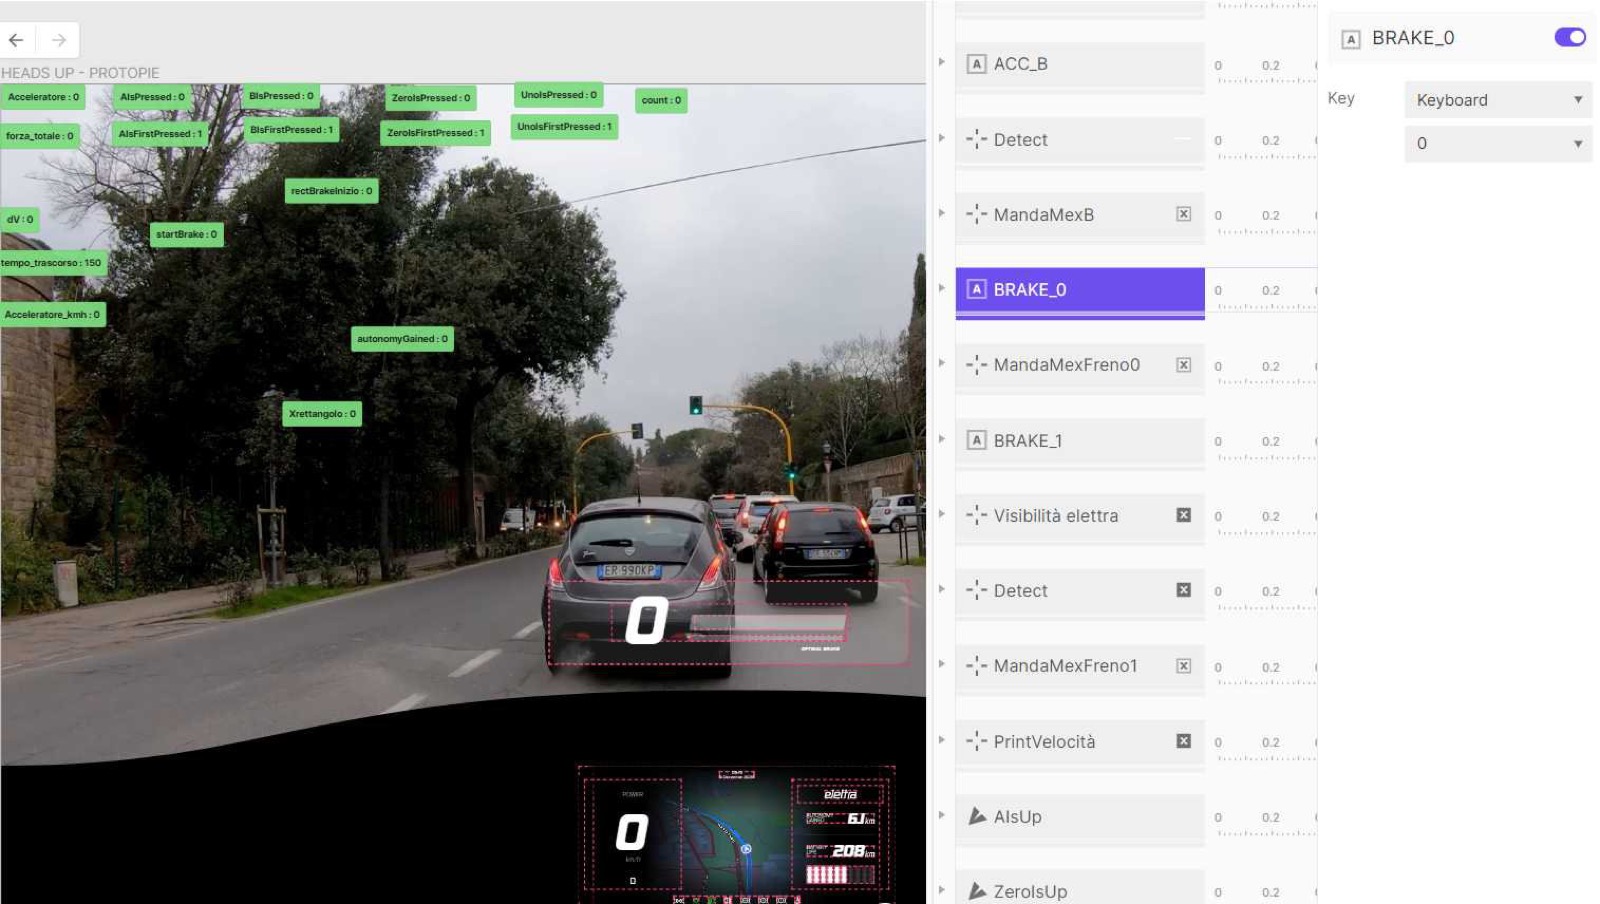
We rebuilt acceleration in ProtoPie, with variables for car mass, friction and pedal time.
Final design
Feedback while driving, a summary once parked.
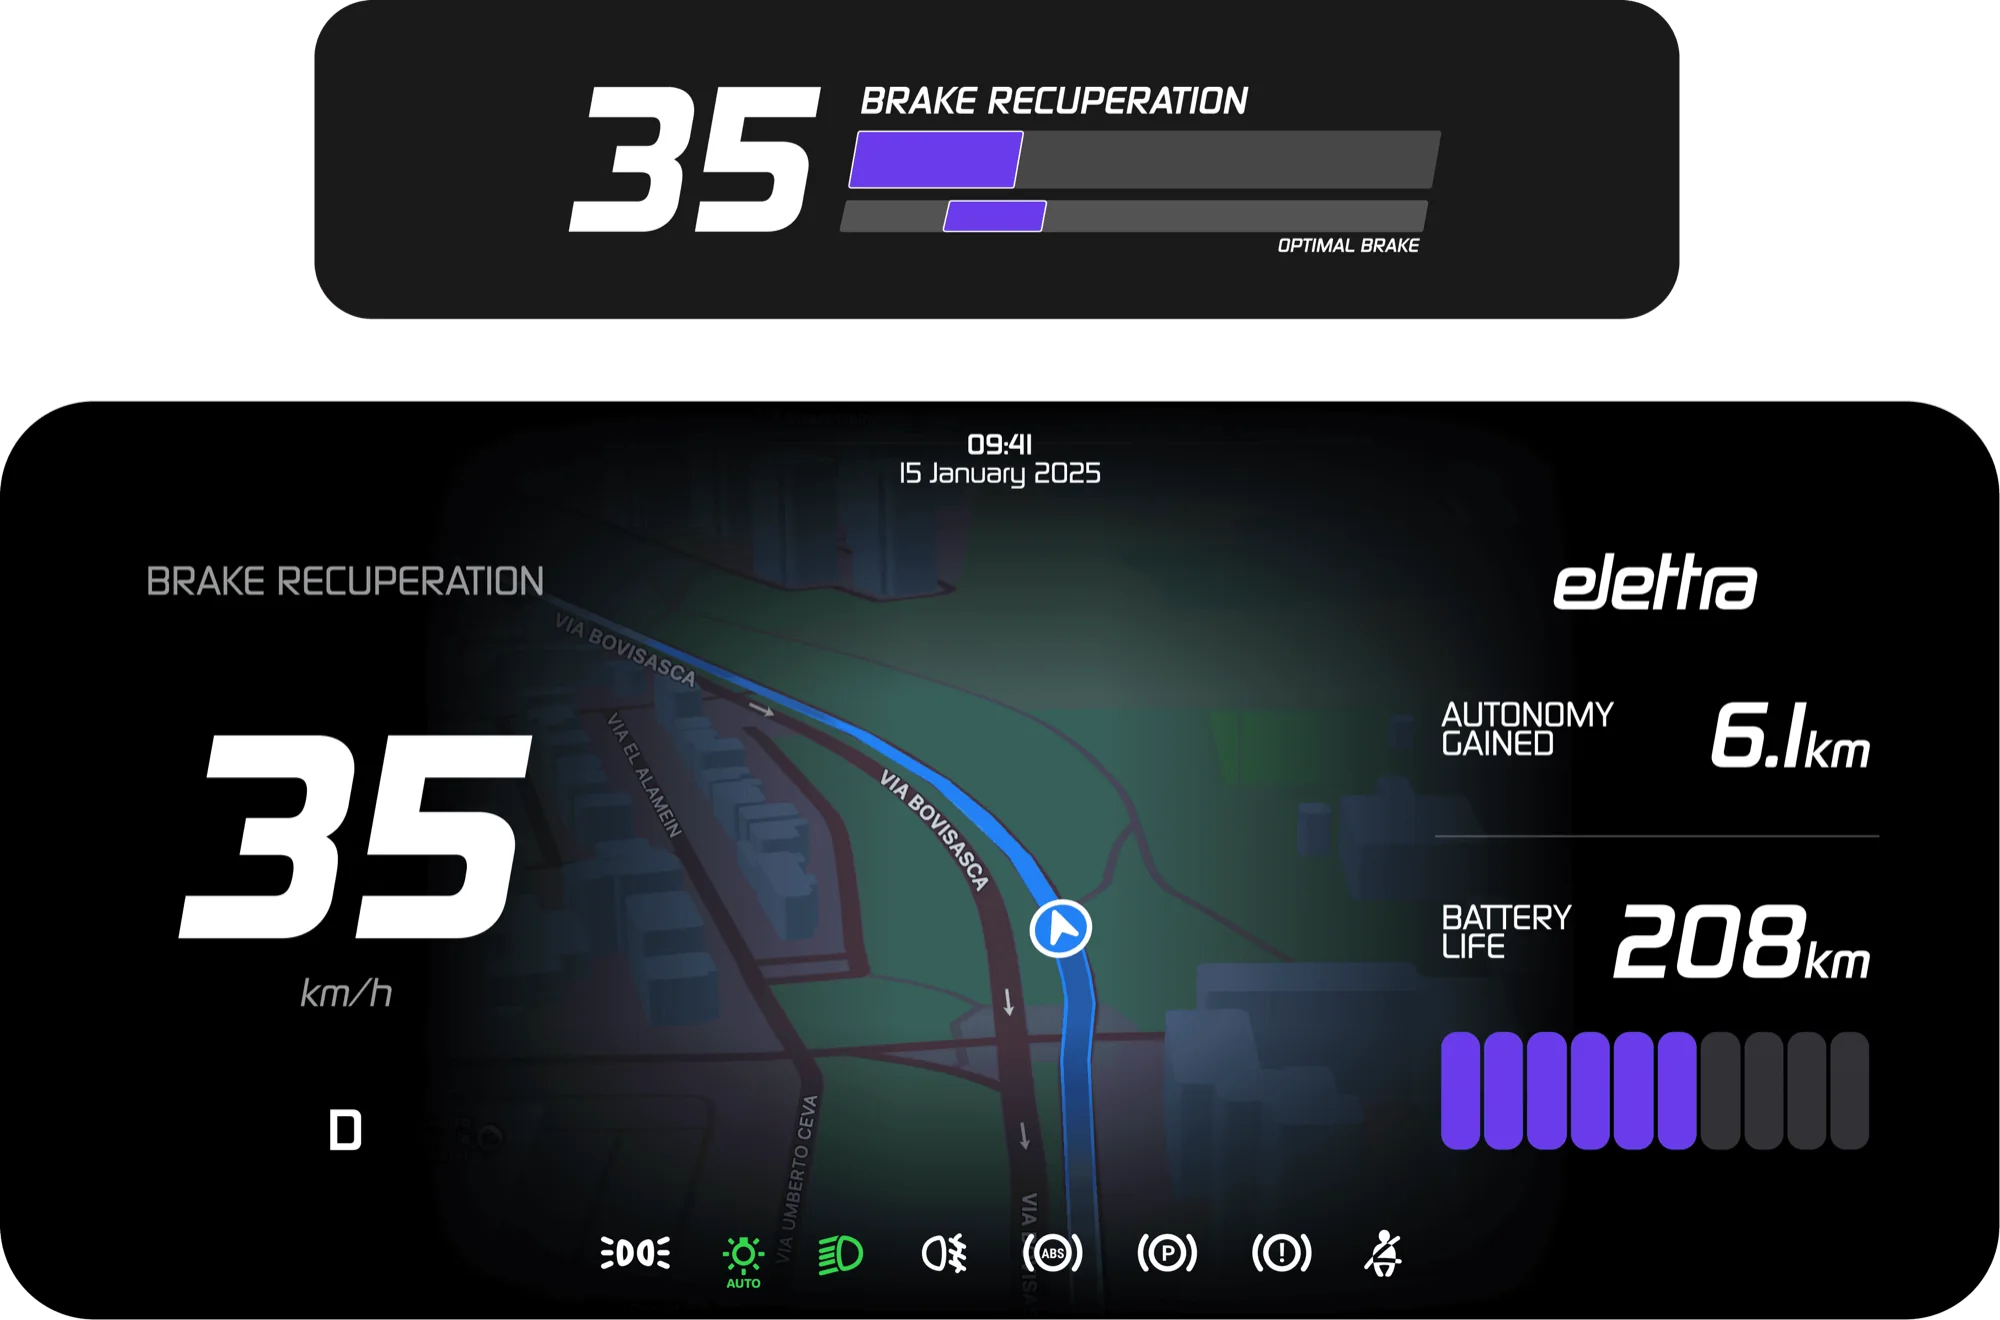
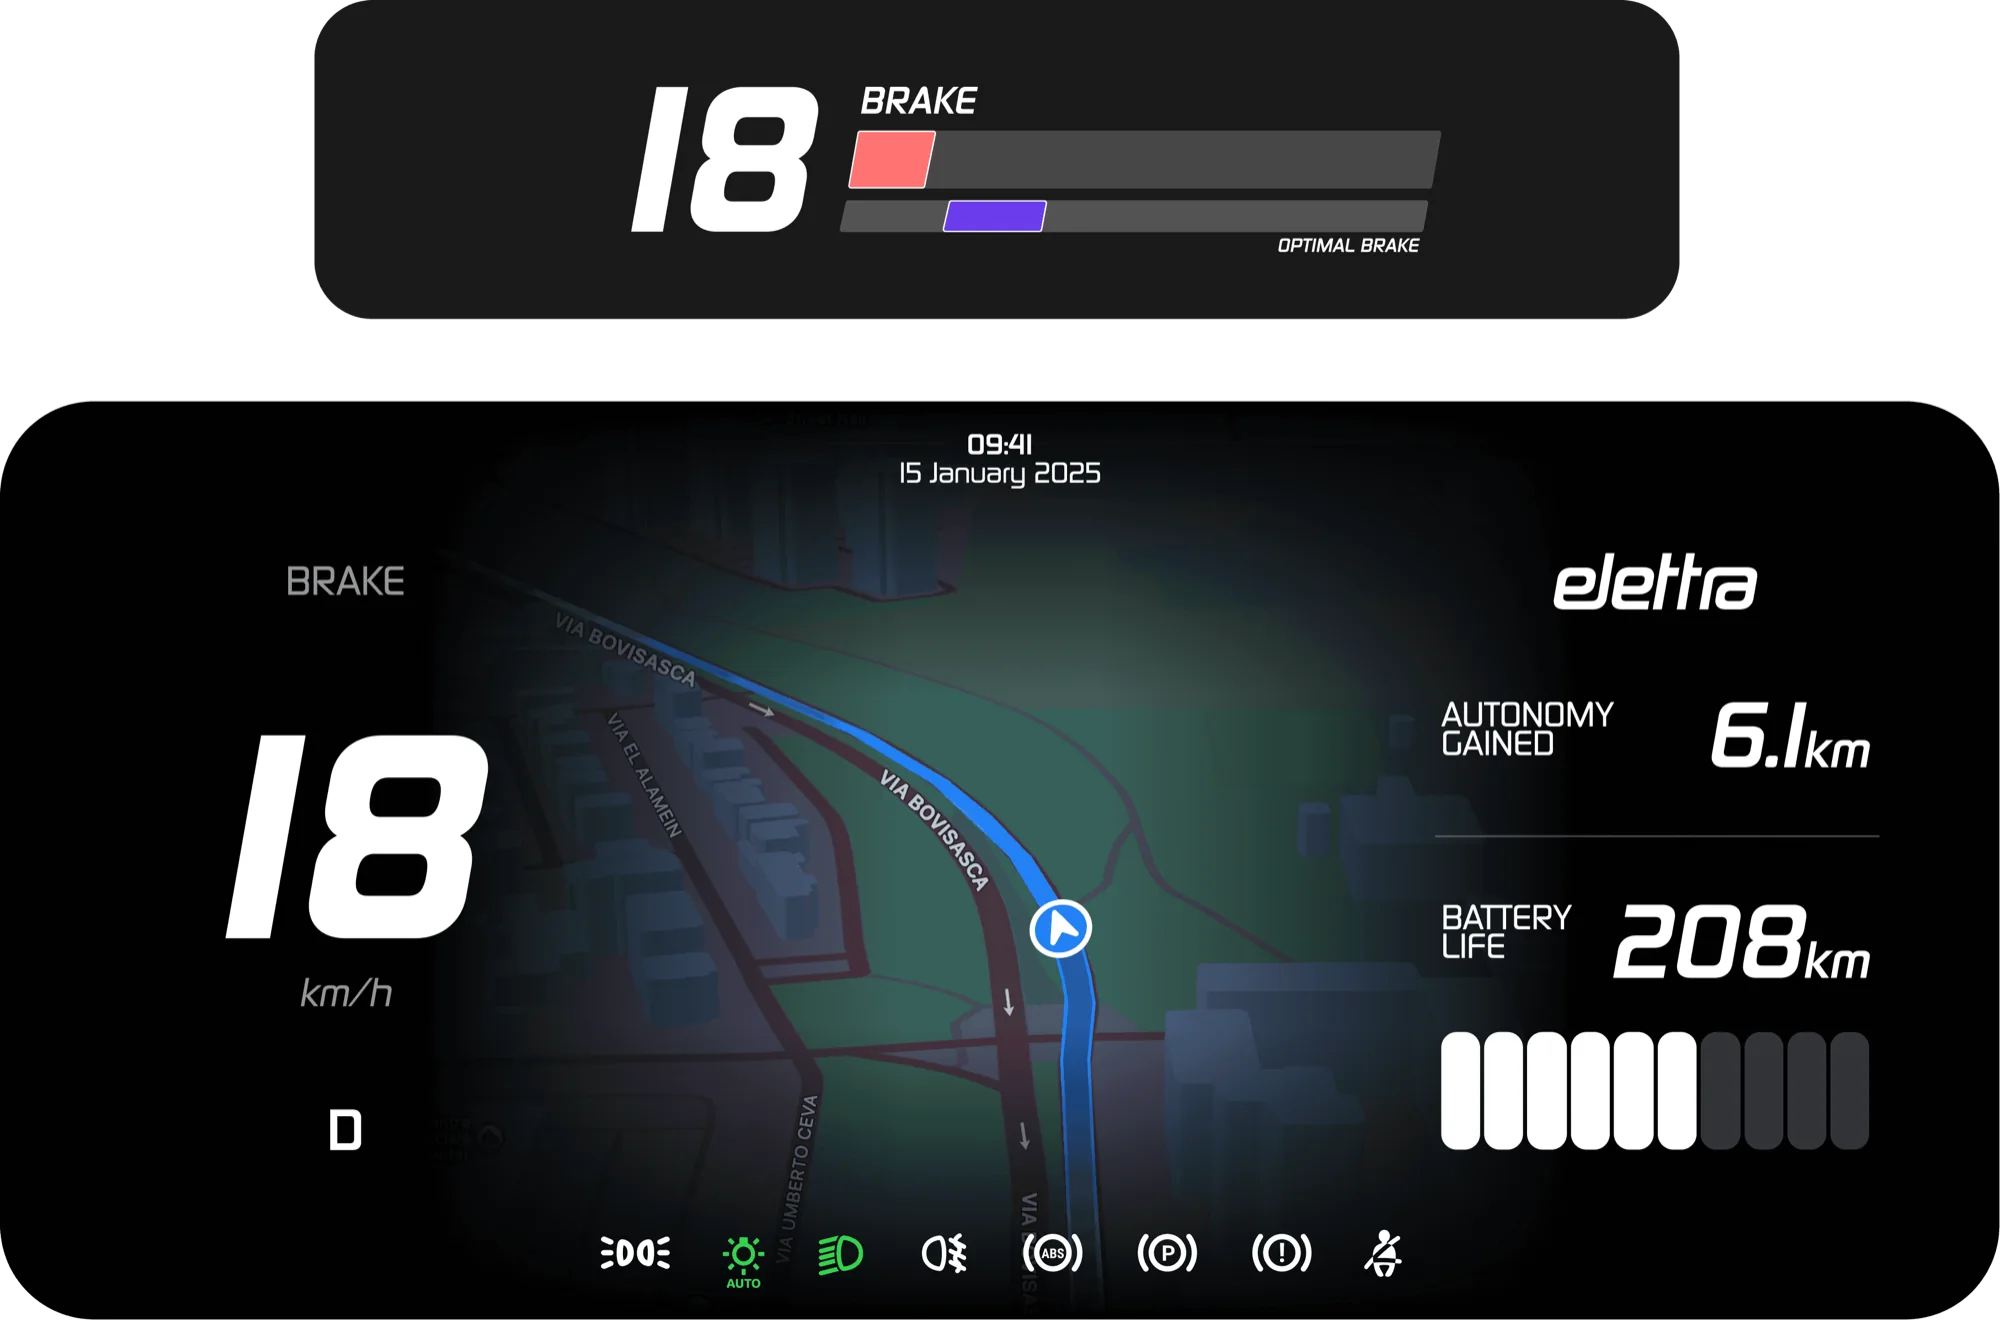
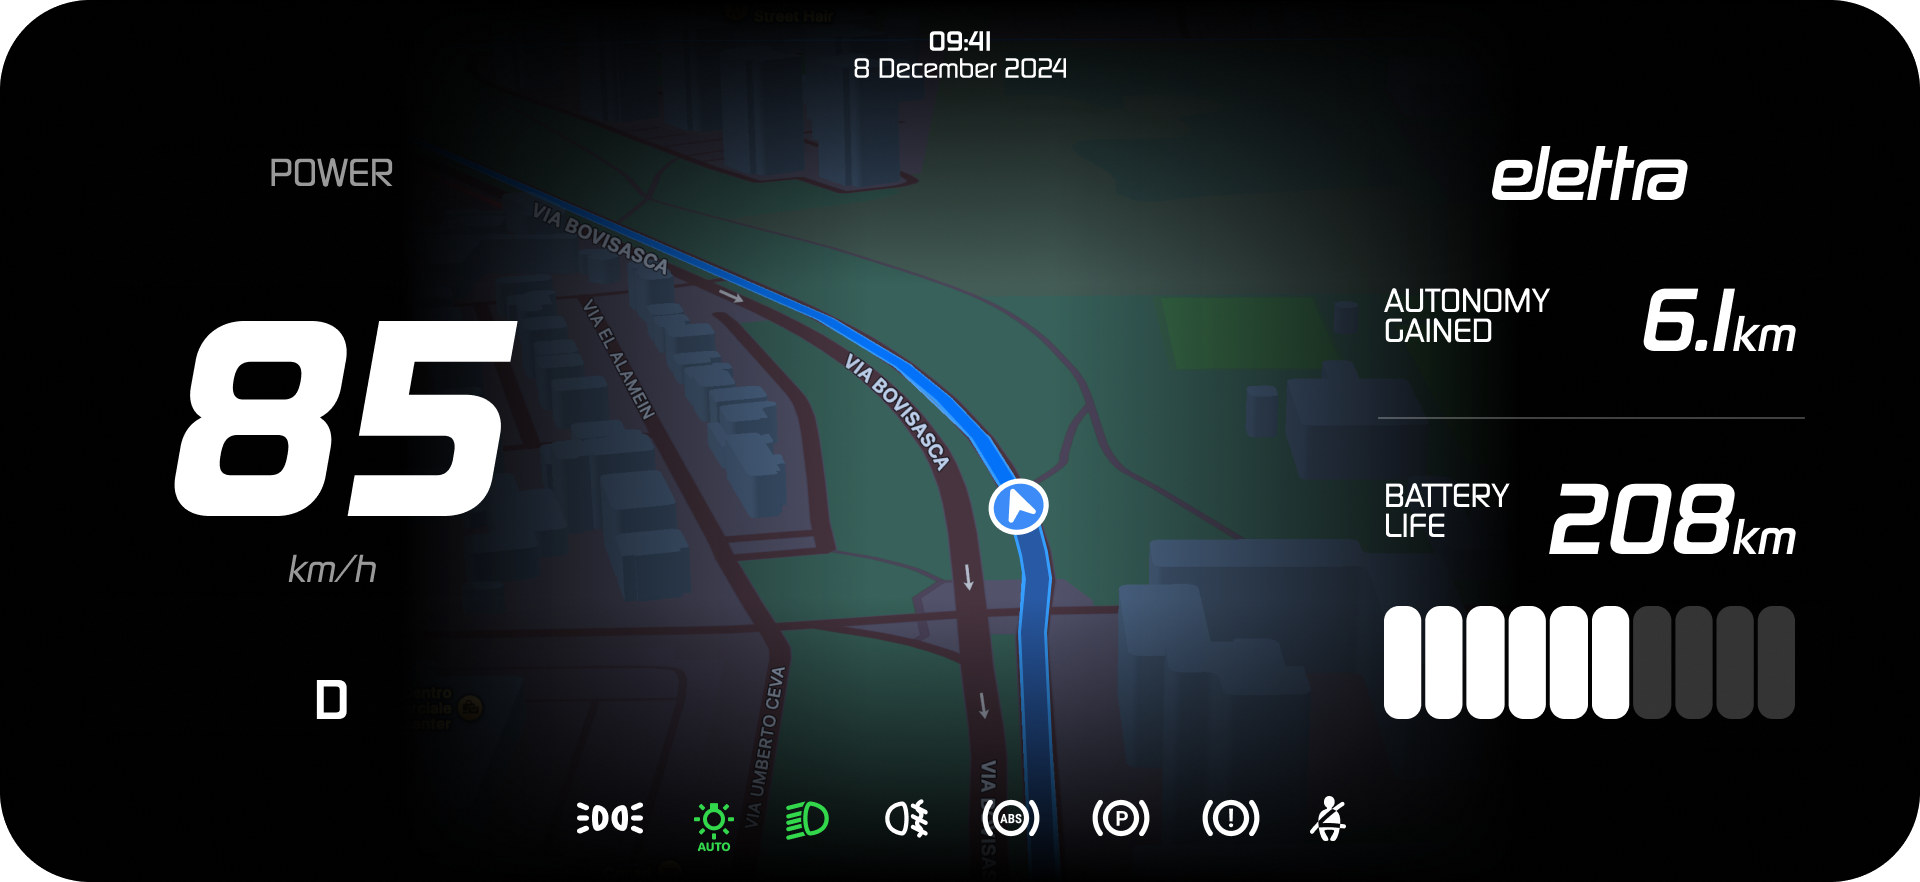
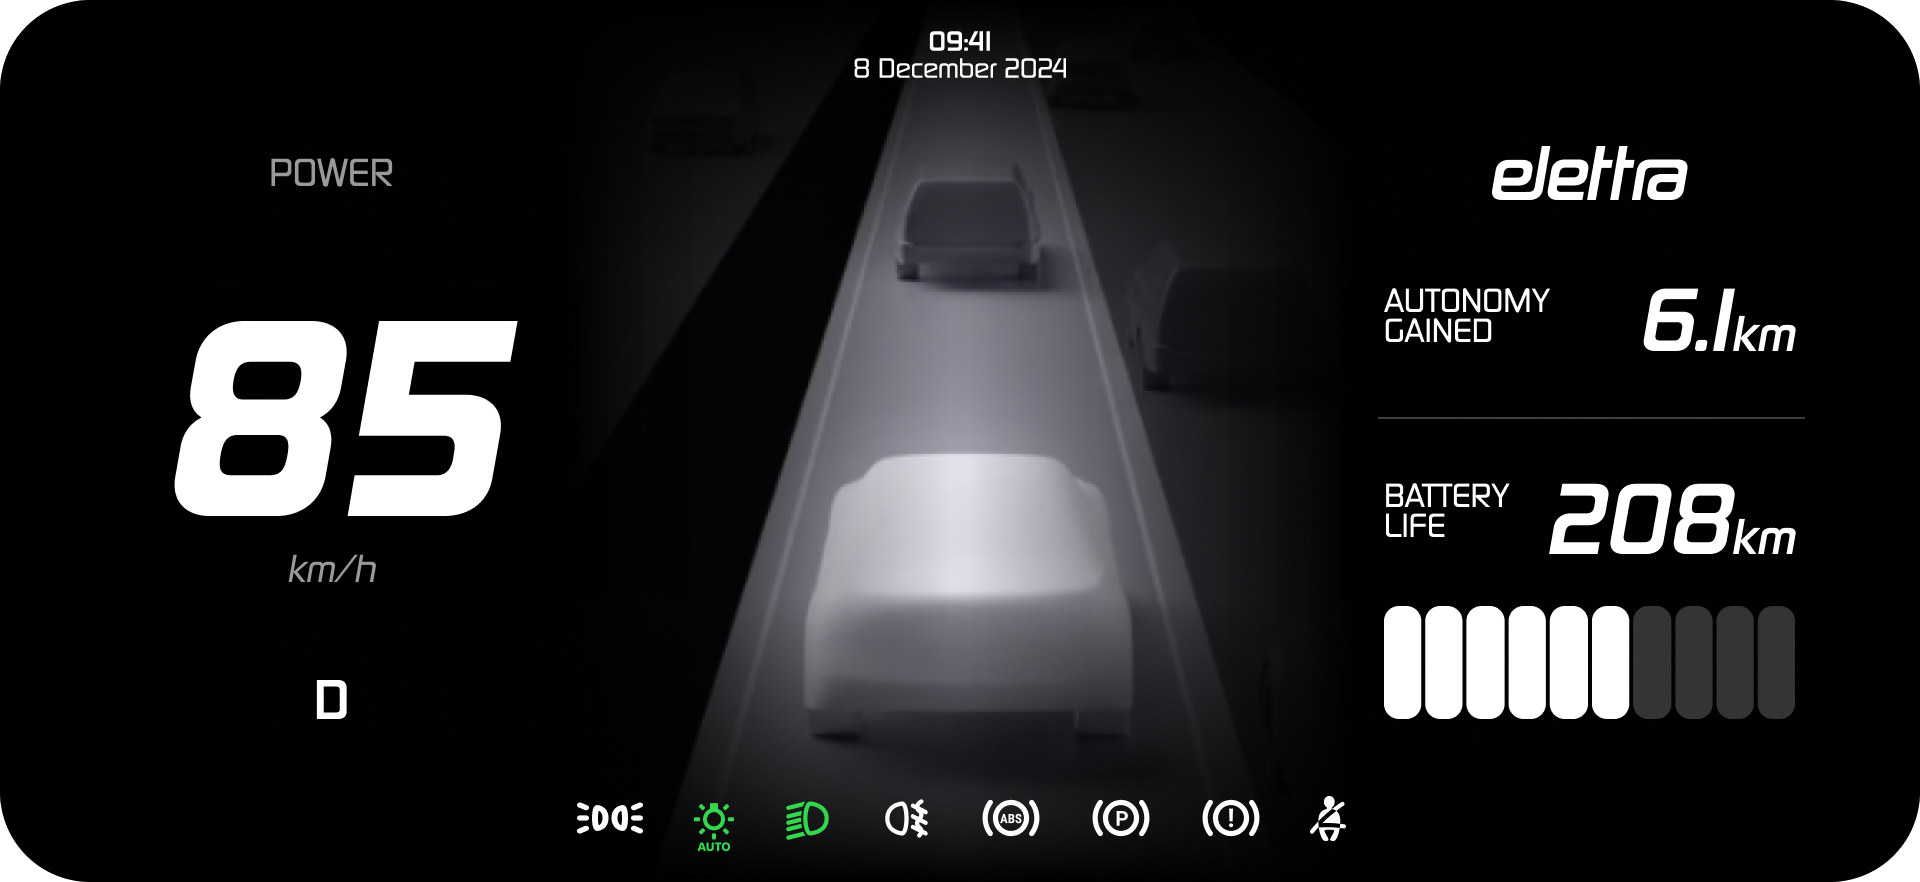
The cockpit in different situations
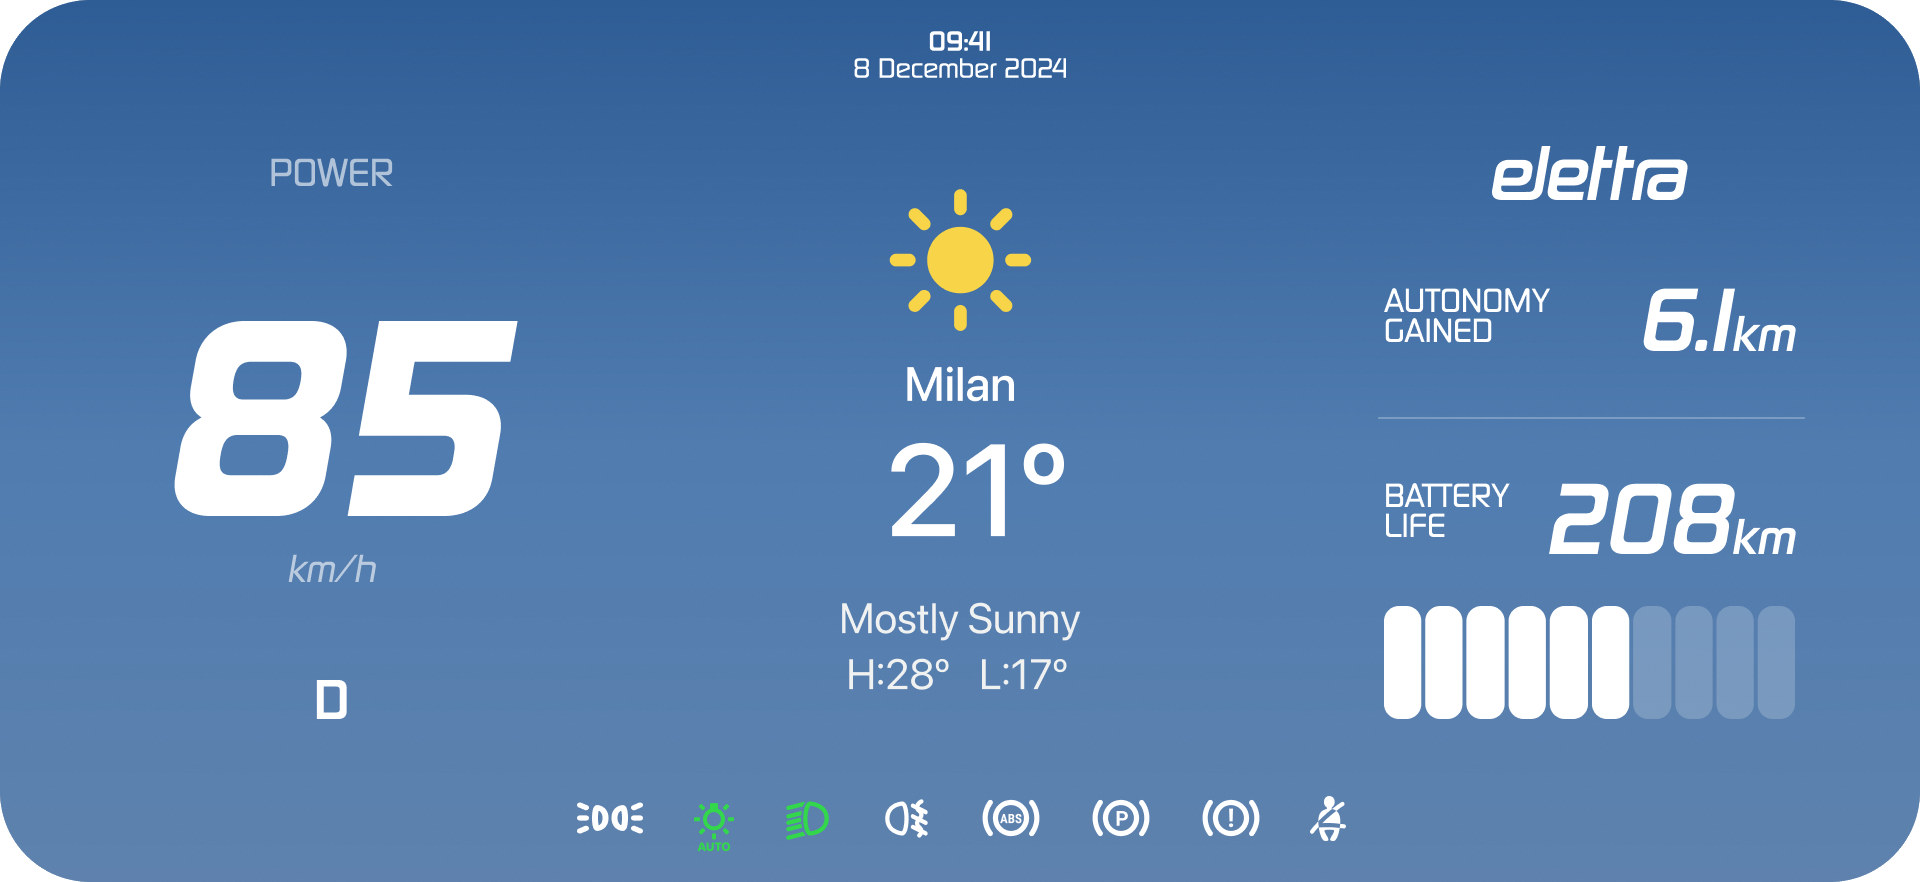
Speed stays on the left and energy on the right. The centre changes with the situation, and “autonomy gained” stays on screen as a reward for good braking.
After the drive
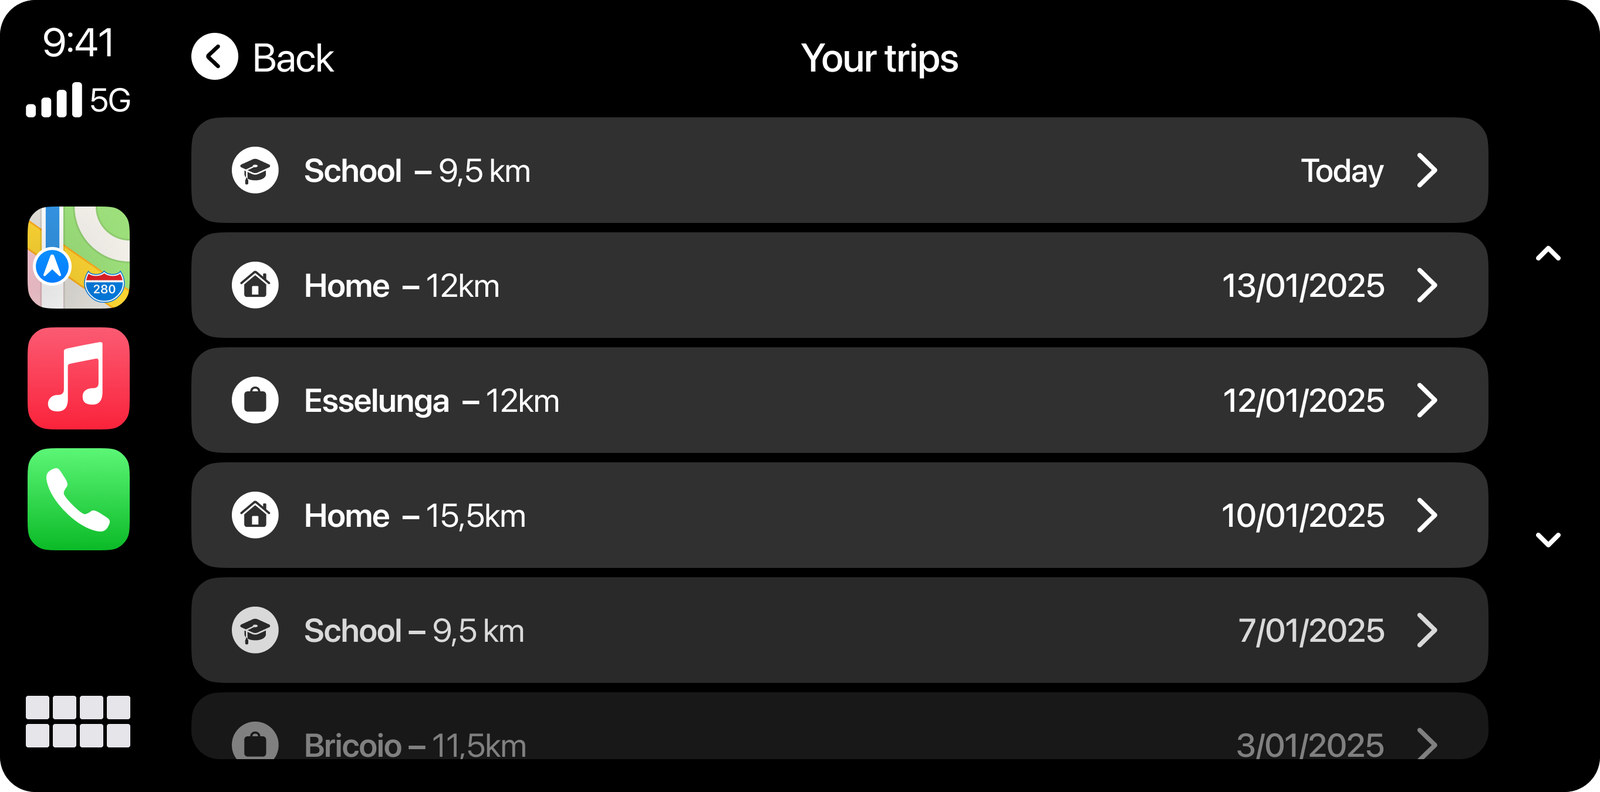
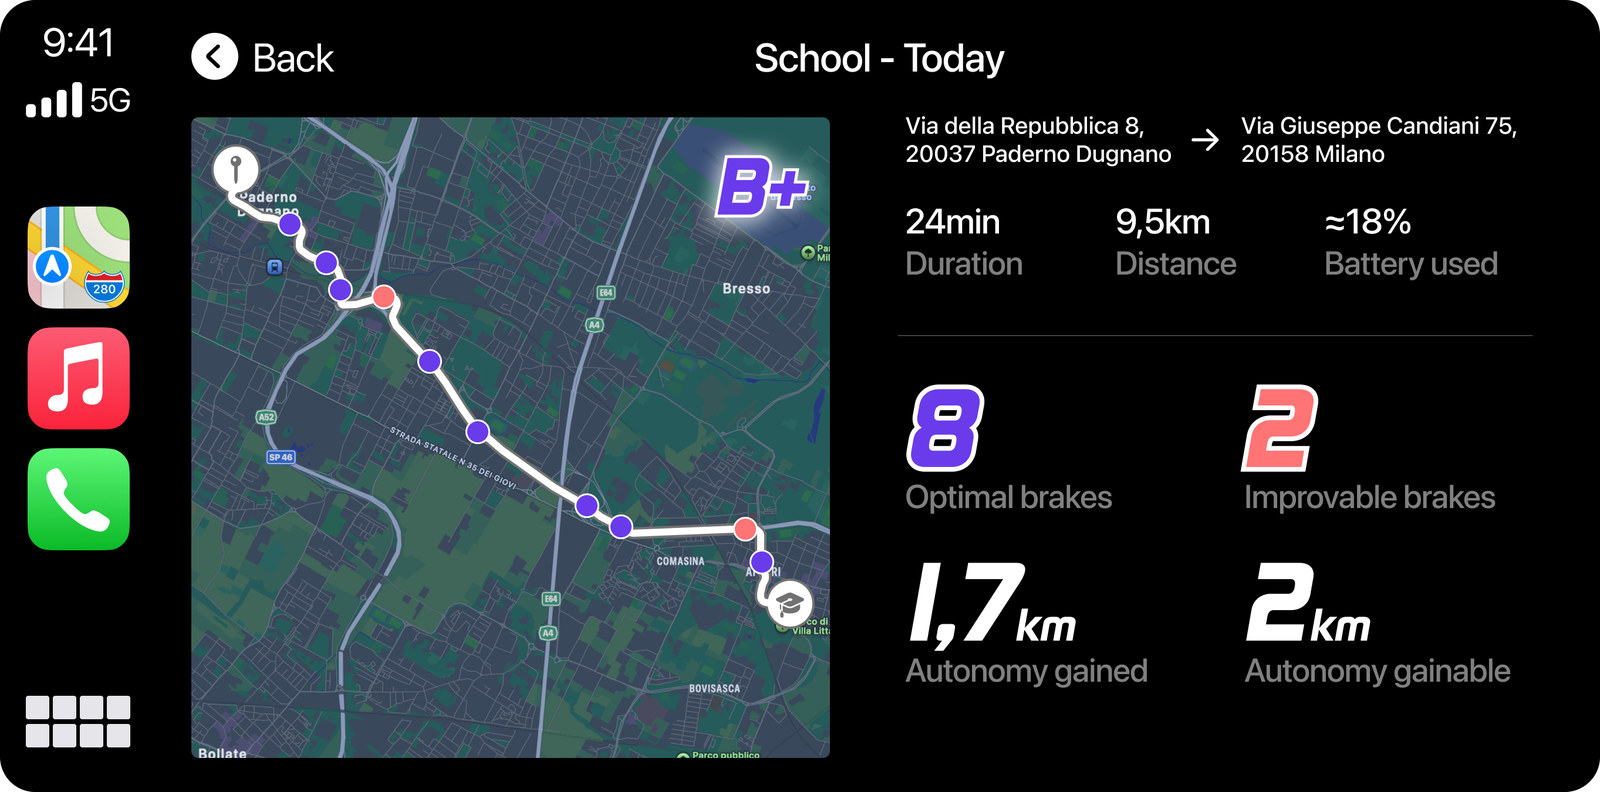
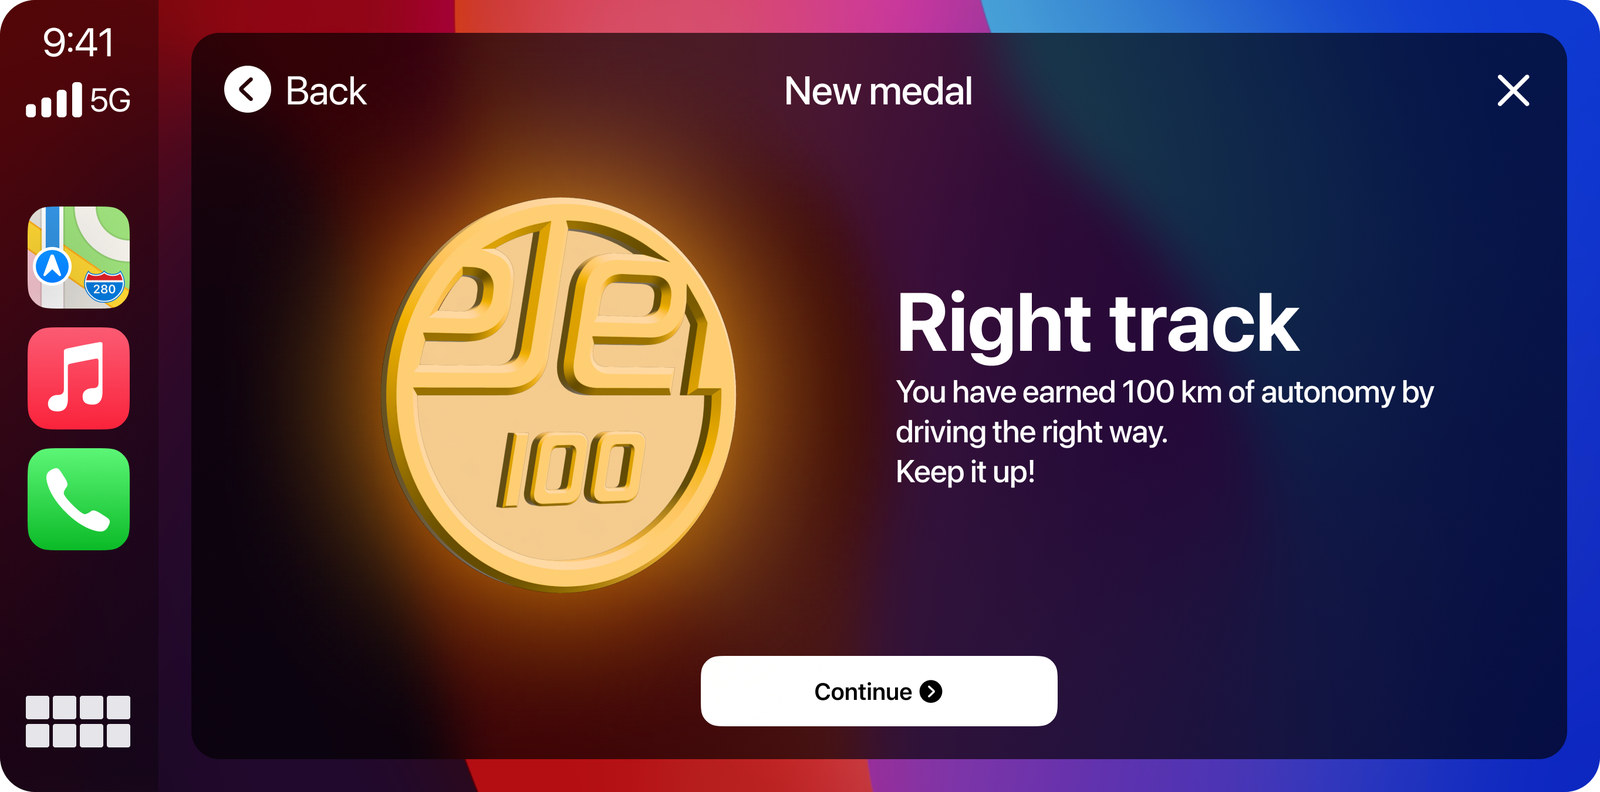
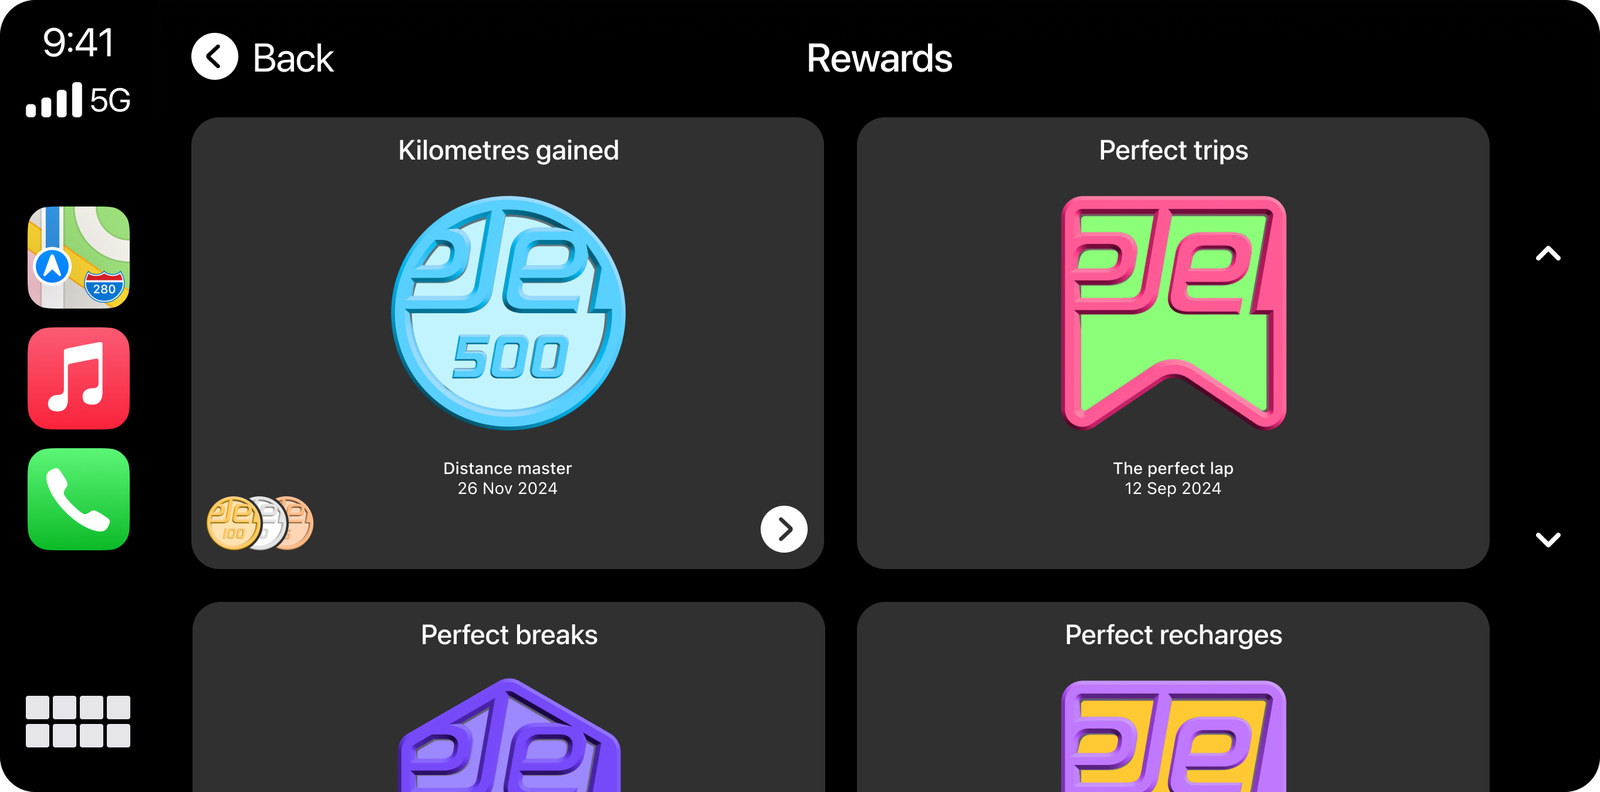
While the car is moving, the central display shows only a splash screen. Once parked, it shows a dashboard with the current trip, autonomy and rewards. Every trip stays in a list, with its route, optimal and improvable brakes, kilometres gained and kilometres still gainable, plus a grade. Medals reward the kilometres recovered over time.